The Aggregate Economy
330 likes | 353 Views
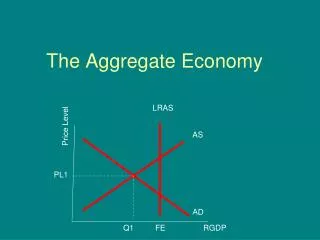
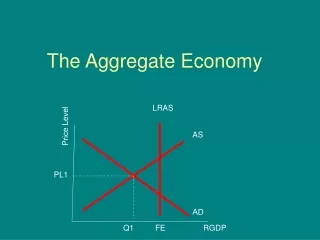
The Aggregate Economy. LRAS. Price Level. AS. PL1. AD. Q1. FE. RGDP. The Aggregate Economy. Economic well being is determined by the level of Real GDP The level of RGDP is determined by current levels of aggregate demand (AD) and aggregate supply (AS).

The Aggregate Economy
E N D
Presentation Transcript
The Aggregate Economy LRAS Price Level AS PL1 AD Q1 FE RGDP
The Aggregate Economy • Economic well being is determined by the level of Real GDP • The level of RGDP is determined by current levels of aggregate demand (AD) and aggregate supply (AS). • Since spending levels are more easily changed than production levels most macroeconomic policy focuses on aggregate demand.
The Aggregate Demand • The level of total spending in an economy is the most important determinant of GDP. • Aggregate demand is the total spending by all four sectors of our economy. AD = Consumption + Investment + Government + Net Exports = GDP • Aggregate demand is determined bycurrent price level and the determinants ofConsumption, Investment, Government , Net Exports
Aggregate Demand(AD) AD A change in Price Level moves the economy along the AD curve. A change in C , I , G or NX moves the location of the curve. Price Level AD2 AD Real GDP
Aggregate Demand • Aggregate Demand slopes downward for three reasons: • The Wealth Effect • The Interest-rate Effect • The Exchange-rate Effect • This differs from the demand curve for an individual item in that an increase in price level overall does NOT diminish my purchasing power in that overall income is tied to overall price levels in the macroeconomy.
Consumption • Consumption (C) • spending by households on goods and services
Determinants of Consumption • Disposable income • Taxes • Wealth (Real Asset Effect or Wealth Effect) • Expectations of prices or income • Debt
Disposable Income (DI) =Yd • Disposable income is the income available after taxes. • All income can either be spent or saved. • The higher your income the more you spend and save and vice versa. • Taxes come out of personal income (personal income – taxes = disposable income = spending + saving) • An increase in taxes reduces both spending and saving and vice versa.
Autonomous Consumption • There is a constant level of Consumption across all levels of disposable income. • If income falls to zero Consumption does not become zero. • Savings become negative because households either use past savings or borrow.
Wealth • Wealth is the accumulation ofsavings. • It can take the form of financial assets or real assets. (Changes in stock or real estate prices will affect your wealth & your spending habits). • The greater your present wealth the less need you have to save and the more you will spend which increases consumption. • An increase in savings decreases consumption.
Expectations of Future Income or Prices • If you expect a raise in the near future you will spend more now and vice versa. • If you think prices will rise in the near future you will spend more now and vice versa.
Debt • Debt is what is owe on previous spending. • The more I owe the less I can spend now. • Debt accumulation is seen as an increase in consumption and a decrease in savings. • Debt reduction is seen as a decrease in consumption and an increase in savings.
Aggregate Demand(AD) These determinants of Consumption cause the aggregate demand curve to shift because Consumption is a direct component of AD. PL AD2 AD3 AD1 RGDP
GLOBAL PERSPECTIVE .986 .976 .972 .940 .907 .873 .869 .842 Average Propensities to Consume, Selected Nations, 1999 .80 .85 .90 .95 1.0 Canada United States Netherlands United Kingdom Germany Italy Japan France Statistical Abstract of the United States, 2000
Investment • Investment (I) • Spending by businesses on capital • Machinery, factories, technology, inventories • Investment Demand (Id) is the quantity businesses want to spend within a given time period. • It is based on a business’s expected rate of net profit. • Net profit is determined by subtracting the expected cost (interest rate) from the expected profit.
Investment Demand Real Interest Rate I d Quantity of Investment
Determinants of Investment Demand • Interest rates – this is the cost of borrowing or forgoing savings • If interest rates are high it would be more profitable to save and less profitable to borrow to spend (point A) • If interest rates are low it would be more profitable to borrow to spend and less profitable to save (point B) • A change in interest causes movement along the investment demand curve
Affect of Interest Rates on Investment Demand A i1 Real Interest Rate i2 B I d Q1 Q2 Quantity of Investment
Determinants of Investment Demand 2. Profit expectations – the following effect business profit expectations a. Cost of production b. Business taxes c. Technological change d. Expectations of future profit e. Stock of capital on hand Changes in profit expectations lead to a change in Investment demand – the curve shifts right or left (Id1 to Id2)
Affect of Change in Profit Expectations Real Interest Rate i1 Id1 Id2 Q1 Q2 Quantity of Investment
Cost of Production • Any change in the cost of inputs will change businesses’ profit expectations and their investment demand. • Cost of inputs increases therefore investment demand decreases (shifts left). • Cost of inputs decreases therefore investment demand increases (shifts right). • The major costs of inputs are wages and oil.
Business Taxes • Increases in businesses taxes reduces businesses’ profits and therefore their investment demand. • Business taxes include corporate income tax, capital gains tax, excise tax. • Increases in taxes shift the investment demand curve left; decreases shift the curve right.
Technological Change • An increase in technology allows businesses to produce at a lower cost and therefore increases their profitsand their investment demand. • An increase in technology shifts the investment demand right; a decrease shifts the curve left.
Expectations of Future Profit • An expected future increase in demand for their product will lead to larger profits and therefore leads to an immediate increase in investment demand. • An increase in expected future profit shifts the investment curve to the right; a decrease shifts the curve to the left.
Stock of Capital on Hand • If companies have capital equipment (factories, tools, etc.) on hand that are not being utilized there is no reason to purchase more (investment demand decreases). • If companies are maximizing their use of capital equipment then they will purchase more (investment demand shifts right).
Aggregate Demand(AD) AD An increase in Investment of causes an increase in AD. A decrease in I causes a decrease in AD. Price Level AD2 AD1 AD3 Real GDP
Volatility of Investment • Investment demand is much more unstable than Consumption. It changes often and to a large degree, due to the following: • The durability of capital goods. • Innovation occurs irregularly. • Profits vary considerably. • Business expectations are easily changed.
Adding Government and Taxes • Government spending creates an injection of funds in the economy. • Government spending increases automatically in a recession. • An increase G increases AD An increase in Government spending increases AD PL AD1 AD2 RGDP
Taxes • Taxes are leakages • They reduce AD, but any change in taxes results in a change in savings and spending • Taxes reduce Consumption spending by change in taxes x households marginal propensity to consume • AD decreases by less than the change in taxes A reduction in taxes of $600 reduces Consumption and AD by $450. PL $450b AD2 AD1 RGDP
Net Exports Net Exports (exports – imports) Determinants of Net Exports: • Income abroad (if foreign income is up our exports go up) • Exchange rates (if the dollar appreciates our exports go down) • Tariffs (if we place a tariff on imports our imports go down) An increase in NX leads to an increase in AD A decrease in NX leads to a decrease in AD
Problems of a National Debt • Crowding-out effect • When government borrows it competes with businesses for savers dollars, raising the interest rate and making it harder for private businesses to borrow. This decrease in business spending can reduce overall GDP.
The Crowding Out Effect Loanable Funds Mkt Investment Demand AD/AS Real Interest Real Interest s AS Price Level i2 i2 PL2 i1 i1 PL3 PL1 D2 AD2 Id AD3 D1 AD1 Q1 Q3 Q2 Q1 Q2 Q2 Q1 Q of Loans Q of Investment RGDP Graph 1: At AD1 we are in a recession. Government cuts Taxes and increases Spending to move the economy to AD2. Graph 2: Because the government is now deficit spending the demand for loanable funds increases causing interest rates to rise. Graph 3: This increase in interest rates decreases Investment spending which causes AD to fall back to AD3 (Graph1 again).
The Aggregate Economy • Aggregate supply measures total production within our economy • It is determined by current price levels and three factors of production • Input prices, productivity levels and legal-institutional factors