Download
1 / 1
20 likes | 106 Views
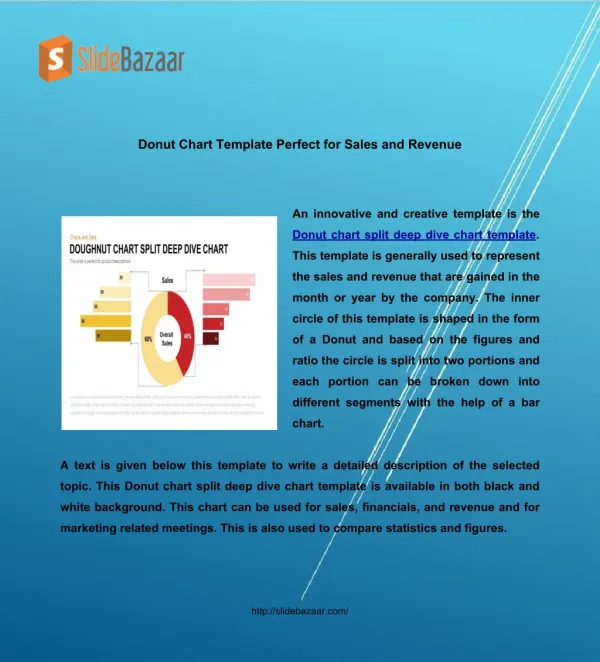
An innovative and creative template is the Donut chart split deep dive chart template. This template is generally used to represent the sales and revenue that are gained in the month or year by the company.

E N D
Donut Chart Template Perfect for Sales and Revenue An innovative and creative template is the Donut chart split deep dive chart template. This template is generally used to represent the sales and revenue that are gained in the month or year by the company. The inner circle of this template is shaped in the form of a Donut and based on the figures and ratio the circle is split into two portions and each portion can be broken down into different segments with the help of a bar chart. A text is given below this template to write a detailed description of the selected topic. This Donut chart split deep dive chart template is available in both black and white background. This chart can be used for sales, financials, and revenue and for marketing related meetings. This is also used to compare statistics and figures. http://slidebazaar.com/