Download
1 / 3
40 likes | 65 Views
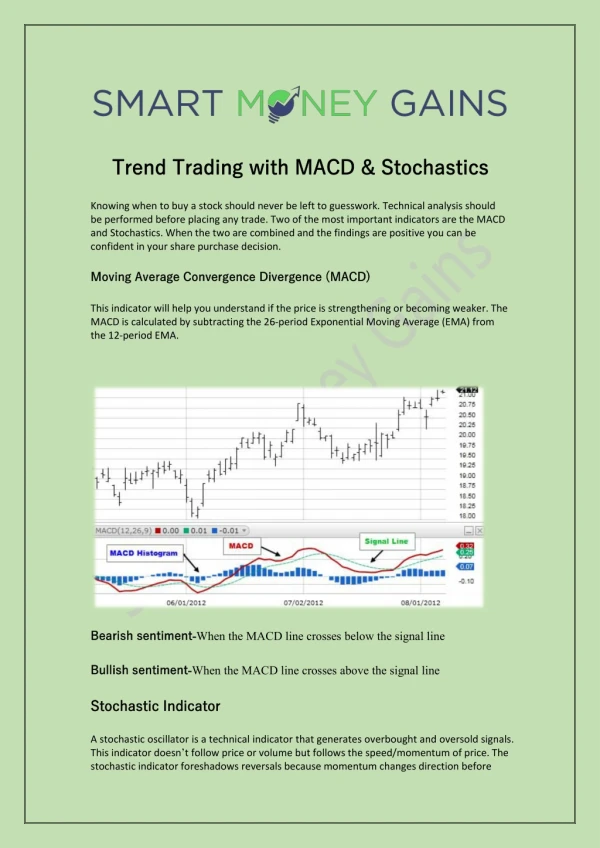
Knowing when to buy a stock should never be left to guesswork. Technical analysis should be performed before placing any trade. Two of the most important indicators are the MACD and Stochastics. When the two are combined and the findings are positive you can be confident in your share purchase decision.

E N D
Trend Trend Trading Trading with with MACD MACD & & Stochastics Stochastics Knowing when to buy a stock should never be left to guesswork. Technical analysis should be performed before placing any trade. Two of the most important indicators are the MACD and Stochastics. When the two are combined and the findings are positive you can be confident in your share purchase decision. Moving Moving Average Average Convergence Convergence Divergence Divergence (MACD) (MACD) This indicator will help you understand if the price is strengthening or becoming weaker. The MACD is calculated by subtracting the 26-period Exponential Moving Average (EMA) from the 12-period EMA. Bearish Bearish sentiment sentiment-When the MACD line crosses below the signal line Bullish Bullish sentiment sentiment-When the MACD line crosses above the signal line Stochastic Stochastic Indicator Indicator A stochastic oscillator is a technical indicator that generates overbought and oversold signals. This indicator doesn’t follow price or volume but follows the speed/momentum of price. The stochastic indicator foreshadows reversals because momentum changes direction before
price. The calculation compares the closing price of a security to its price range. A Low reading indicates that price is near its low for the given time period. High readings indicate that price is near its high for the time period you are tracking. Overbought: Overbought: When the Stochastic line raises above 80 the stock is overbought. This is considered a sell signal. Oversold: Oversold: When the Stochastic line falls below 20 the stock is oversold. This is a buy signal when it crosses the trendline and momentum shifts. The The MACD MACD Stochastic Stochastic Trading Trading Strategy Strategy Combining the two indicators works well because they both indicate price action but are calculated differently. You remove the weakness of each indicator and increase your chances of purchasing a stock at the right time. A great trading strategy based on the two indicators can be very effective. The MACD indicator is used as a filter to avoid the false trading signals whilst the stochastic oscillator indicator gives you either the buy or sell signal.
Bottom Bottom Line Line Investing decisions need to be data driven and calculated. For the best results make sure you check both of these indicators before placing your next trade. A free solution that automates the calculations for you can be found here.