NCBI data, sliding window programs and dot plots
NCBI data, sliding window programs and dot plots. Sept. 25, 2012

NCBI data, sliding window programs and dot plots
E N D
Presentation Transcript
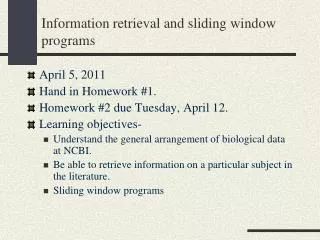
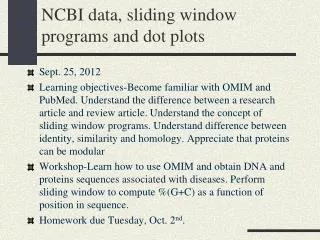
NCBI data, sliding window programs and dot plots • Sept. 25, 2012 • Learning objectives-Become familiar with OMIM and PubMed. Understand the difference between a research article and review article. Understand the concept of sliding window programs. Understand difference between identity, similarity and homology. Appreciate that proteins can be modular • Workshop-Learn how to use OMIM and obtain DNA and proteins sequences associated with diseases. Perform sliding window to compute %(G+C) as a function of position in sequence. • Homework due Tuesday, Oct. 2nd.
Primary public domain bioinformatics servers Public Domain Bioinformatics Facilities Genome Net (KEGG & DDBJ) Japan European Bioinformatics Institute (EBI) United Kingdom National Center For Biotechnology Information (NCBI) United States Databases Databases Analysis Tools Analysis Tools Databases Analysis Tools
NCBI ENTREZ • A platform that provides access to and links to databases with biological information ENTREZ PubMed PopSet Genomes Protein databases OMIM Taxonomy GenBank MedLine
NCBI ENTREZ MedLine Literature Database OMIM Database of human genes and genetic disorders GenBank Database of all publicly available DNA sequences Database of amino acid sequences from Uniprot, Protein Research Foundation, PDB. Protein databases Database of genomes from organisms and viruses Genomes Database of DNA sequences that have been collected to analyze the evolutionary relatedness of a population. PopSet Taxonomy Database of names of organisms with sequences in GenBank.
Literature Databases • Medline/Pubmed • OMIM • CSULA Library • Bookshelf (from NCBI) • Melvyl (Books at UC Libraries) • Other molecular life science databases • Science Direct • Pub Med Central • Free Medical Journals • LinkOut Journals • Wiley InterScience
OMIM-Online Mendelian Inheritance in Man • A catalog of human genes linked to diseases • Victor A. McKusick at Johns Hopkins University • A good place to start when you want to research a certain disease or biological molecule • This database is cross-referenced to PubMed and other NCBI-based databases
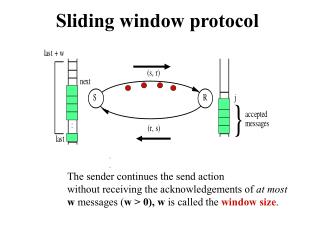
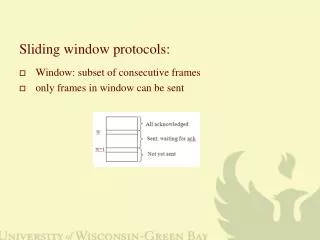
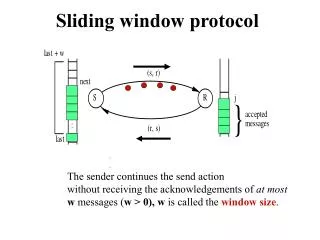
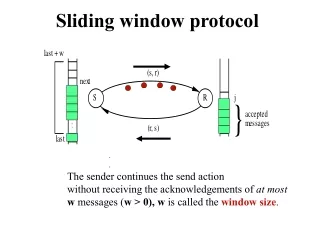
4 GCATATGCGCATATCCCGTCAATACCA 5 GCATATGCGCATATCCCGTCAATACCA 6 GCATATGCGCATATCCCGTCAATACCA Sliding window A sliding window-gathers information about properties of nucleotides or amino acids. A simple example is to calculate the %(G+C) content within a window. Then move the window one nucleotide and repeat the calculation.
Sliding window If the window is too small it is difficult to detect the trend of the measurement. If too large you could miss meaningful data. Small window size %(G+C) Sequence number Large window size %(G+C) Sequence number
Sliding window Adapted from Zhao et al, BMC Genomics. 2007 Nov 7;8:403.
Complex folding patterns- Interactions between polypeptides Four levels of protein structure Linear sequence- AGHIPLLQ 1) Primary 2) Secondary 3) Tertiary 4) Quaternary Initial folding patterns-AGHIPLLQ aaaTTTbb
Kyte-Doolittle Hydropathy – A sliding window software program [J. Mol. Biol. 157:105-132 (1982)]. The seven known membrane-spanning regions are numbered 1-7 in red on the plot. Note that this particular software program averaged the hydropathy values in the window (http://www.vivo.colostate.edu/molkit/hydropathy/index.html). The original program by Kyte and Doolittle summed the hydropathy values.
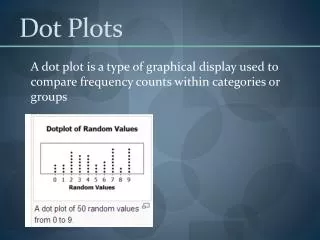
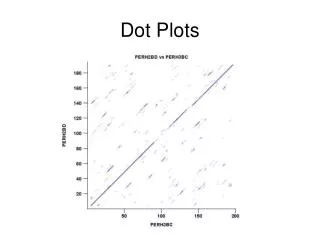
A T G C C T A G ● ● A T G C C T A G ● ● ● ● ● ● ● ● ● ● ● ● ● ● Dot Plot with window = 1 Window = 1 Note that 25% of the table will be filled due to random chance. 1 in 4 chance at each position
Dot Plot with window = 3 Window = 3 The larger the window the more noise can be filtered What is the percent chance that you will receive a match randomly? One in (four)3chance. (¼)3 * 100 = 1.56%
Do workshop #2 • Answer questions 1-3
Evolutionary Basis of Sequence Alignment 1. Identity: Quantity that describes how much two sequences are alike in the strictest terms. 2. Similarity: Quantity that relates how much two amino acid sequences are alike. 3. Homology: A conclusion drawn from data suggesting that two genes share a common evolutionary history.
Purpose of finding differences and similarities of amino acids in two proteins. • Infer structural information • Infer functional information • Infer evolutionary relationships
Modular nature of proteins • Proteins possess local regions of similarity. • Proteins can be thought of as assemblies of modular domains.
Two proteins that are similar in certain regions Tissue plasminogen activator (PLAT) Coagulation factor 12 (F12). Baxevanis and Ouellette, Bioinformatics, Wiley-Interscience, New York, 2001
The Dotter Program • Program consists of three components: • Sliding window • A table that gives a score for each amino acid match • A graph that converts the score to a dot of certain density • (the higher the dot density the higher the score)
Dot plot of sequence alignment highlighting Kringle domain alignments. Adapted from Baxevanis, Ouellette: Bioinformatics: A Practical Guide to the Analysis of Genes and Proteins, 2nd Edition.