Download
1 / 12
130 likes | 295 Views
4.4 Outliers and Dot Plots. What is an outlier?. Sometimes, distributions are characterized by extreme values that differ greatly from the other observations. These extreme values are called outliers. . How do you know if a data point is an outlier?. LOWER BOUNDARY. UPPER BOUNDARY.

E N D
What is an outlier? • Sometimes, distributions are characterized by extreme values that differ greatly from the other observations. These extreme values are called outliers.
How do you know if a data point is an outlier? LOWER BOUNDARY UPPER BOUNDARY EX 2: 49, 65, 58, 46 Would 80 be an outlier? Would 84 be an outlier? • EX 1: 16, 19, 20, 24, 28 • Would 3 be an outlier? • Would 5 be an outlier?
Create a Box plot and determine: • Min • Q1 • MED • Q3 • Max • Outlier Boundaries (lower and upper) • 16, 22, 19, 18, 12, 10, 17, 14, 18, 21, 16, 20, 20
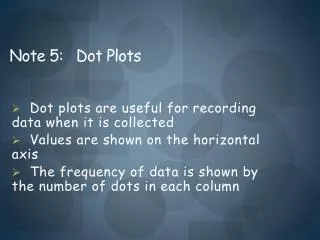
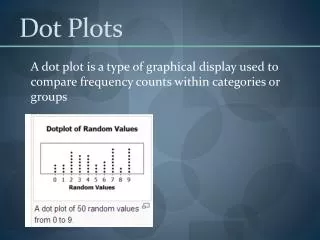
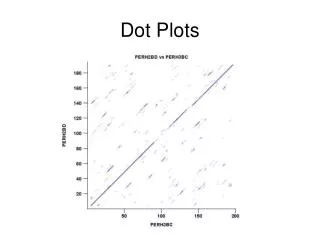
Dotplot Advantages Disadvantages Takes a long time to construct if many data points • See every data point • Quickly see the range (highest and lowest point) • Easy to see the mode (most frequent data point)
Creating a Dot plot • Create a dot plot for the following data: 52, 43, 61, 69, 69, 55, 62, 52, 47, 54, 69, 43, 53,48
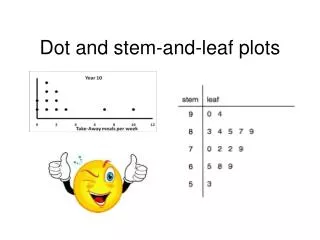
Stem and leaf plots The Stem-and-Leaf Plot is a type of graph where the data is arranged by place value. The digits in the largest place are referred to as the stem and the digits in the smallest place are referred to as the leaf (leaves). The leaves are displayed to the right of the stem. Stem and Leaf Plots are great organizers for large amounts of information.
Creating Stem and leaf plots • 15, 16, 21, 23, 23, 26, 26, 30, 32, 41 • 126, 106, 95, 114, 98, 107, 114, 128, 134, 117, 122, 129