1 / 0

What drives asymmetric dependence structures of asset return comovements?

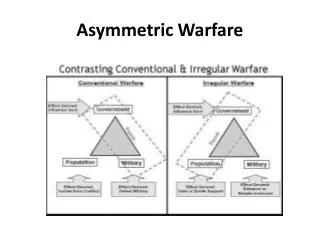
What drives asymmetric dependence structures of asset return comovements?. Anandadeep Mandal Ph.D. Student Cranfield School of Management, Cranfield University, England May 8 th 2014, Sussex. Outline. Introduction Problem Statement Research Questions and Objectives Data Used

skylar
Download Presentation

What drives asymmetric dependence structures of asset return comovements?

An Image/Link below is provided (as is) to download presentation Download Policy: Content on the Website is provided to you AS IS for your information and personal use and may not be sold / licensed / shared on other websites without getting consent from its author. Content is provided to you AS IS for your information and personal use only. Download presentation by click this link. While downloading, if for some reason you are not able to download a presentation, the publisher may have deleted the file from their server. During download, if you can't get a presentation, the file might be deleted by the publisher.

E N D

Presentation Transcript


  1. What drives asymmetric dependence structuresof asset return comovements?

    Anandadeep Mandal Ph.D. Student Cranfield School of Management, Cranfield University, England May 8th 2014, Sussex
  2. Outline Introduction Problem Statement Research Questions and Objectives Data Used Methodology Estimation of Marginal Models Estimation of Dependence Structures Dynamic Modelling of Dependence Structures Structural Models of State variables Findings State variables Dependence structures Contributions Robust Checks
  3. Introduction (Context) Evidence from 2007-08 economic downturn Collapse of financial institutions Oil prices witnessed high volatility Federal Reserve’s stimulated response led to extremely low interest Corporate bond spreads widened appreciably Gold prices reached new highs Increased financial asset return linkages significantly impact asset allocation strategies
  4. Return Expected Asset Return Models Risk Mean-Variance Efficient Frontier Volatility and Correlation Estimates Portfolio Optimization Constraints on Portfolio Choices Portfolio Selection Introduction (Motivation) Academic researchers, policy makers and investors are keen to have a deeper understanding of the co-movements among various asset classes Influences of return comovements will aid in optimal portfolio design
  5. Introduction (Return Linkages) Extant literature primarily uses linear dependence measure Research widely acknowledges non-normal return distributions Under non-normal circumstance linear measure of association mis-specifies the return distributions
  6. Problem Statement Research Gap Extant literature primarily uses linear dependence structure to explore the return dynamics of the assets Previous research fails to explore the asset linkages during the extreme market conditions that correspond to the upper and the lower tails of the return distribution Literature on determinants on asset return comovements, other than Equity-Bond returns, is minimal Methodological Complexities Modelling scale-free dependence measure Modelling the tail dependence structures which follow an evolutionary path Estimation Complexities Maximum Likelihood estimation is difficult to compute as the number of unknown parameters increases during the construction of scale-free dependence measure The iterative process of Kalman filter estimation of the Markov Switching Stochastic Volatility (MSSV ) models become path dependent
  7. Research Questions Do dependence structures exhibit evidence of regime switching behavior? What factors impact on the dependence structure of the asset return comovements? Whether the impact of the economic sources on the dependence structures is the same in different regimes?
  8. Distinct Features of the Study - I Include financial assets other than the conventional assets (ten combinations of asset pairs) Period of study (1987-2012) captures the effects of economic downturns caused by several financial crises Usage of dynamic conditional t-copula model as an alternative measure of association which overcomes the limitations of simple linear correlation
  9. Distinct Features of the Study - II Include wide range of economic sources to explore the determinants of the dynamics of the dependence structures Impose structural restrictions to the economic sources inspired by New-Keynesian dynamics The regime-switching models accommodates for heteroskedastic shocks in the state variables Decompose the performance of the model to examine the impact of macroeconomic and the non-macroeconomic factors
  10. Data Used - I Monthly data from the fourth quarter of 1987 to the fourth quarter of 2012 The sample includes Standard and Poor’s (S&P) 500 index (E) US 10 year Government bond return index (B) S&P GSCI Gold index (G) West Texas Instrument crushing crude oil price index (O) S&P Case-Shiller Composite home price index (RE) for real estate The price indexes are obtained from DataStream
  11. Data Used - II (Channels of Influence) Macro Risk-free rate Output gap Inflation Risk averseness Non-Macro Output uncertainty Inflation Uncertainty Market Liquidity Ratio Default Spread Term Spread Variance Premium Depth of Recession
  12. Estimation of Marginal Models Marginal distribution of the equity returns are modelled using ARMA (p, q) – EGARCH (1, 1)-t process The models are characterized as The order of the ARMA terms are determined using Akaike Information Criteria (AIC) The marginal models are free from autocorrelation and heteroskedastic Adequacy of the marginal estimations is confirmed using Diebold et al.’s (1998) misspecification tests
  13. Estimation of Dependence Structure The dependence structure is modelled using conditional time-varying copula models The upper and the lower tails are characterized as We allow the tail dependence to follow an evolutionary process
  14. Estimation of the Copula Models The dependence parameter of the Student-t and modified Joe-Clayton (MJC) is estimated using maximum likelihood (ML) method. The joint densities are written as The log-likelihood of the random variables that define the marginal distribution of returns are characterized as The copula parameters are estimated using
  15. Dynamic Modelling of Dependence Structure The model allows the volatility to vary across different regimes. Assuming constant volatility in two regimes will yield in either underestimation or overestimation of the volatility. Thus, Stochastic Volatility (SV) model and Markov Switching (MS) model arecombined The SV model is developed as an extension of the time-diffusion process The model allows the volatility to evolve stochastically The MS model is characterized as The probability of the states are defined as
  16. Estimation Filters for the MSSV model The Kalman filter employed for projection is an iterative process. It forecasts the state variable at period and updates it when Z (t) is observable. The equations is modeled as: The log-volatility is forecasted and is then updated using The conditional densities are computed using
  17. Estimation Filters for the MSSV model Contd… To make the process path independent we compute the conditional expectation of the log-volatility by taking the weighted average output of the previous iteration The regime probabilities are calculated using modified Hamilton filter
  18. Structural Model for the Macro Variables New-Keynesian model captures the time-varying risk aversion dynamics in the structural models The structural models comprise of three equations: The demand equation (IS) The aggregate supply equation (AS) Forward feeding monetary policy rule (MP)
  19. Findings: State Variables Structural factor models show significant regime-switching behavior The inflation regime follows the real economy shocks closely Output and inflation witness regime changes in four specific periods Permanent switch to low volatility regime for both output and inflation uncertainty Risk aversion shows a stronger counter-cyclicality Evidence of illiquidity regimes for equity and bond markets
  20. Findings: Dependence Structures Evidence of regime switching behavior of dependence structure of asset return comovements Regime states are different for different pairs of asset return comovements Evidence of contagion in financial markets across different asset classes Non-macro variables play a significant role in defining the dependence structure during periods of economic contraction Macroeconomic variables have greater impact during the economic expansion phase
  21. Research Contribution (Methodology) The Copula models allow for the estimation of scale-free dependence structure in examining the tails of the return comovements The conditional time-varying Copula model accommodates for the evolutionary process of the dependence structure The models allow for changes in the macroeconomic and non-macroeconomic factors and capture heteroskedastic shocks The Markov switching model is flexible to accommodate autoregressive coefficients Modified Hamilton algorithm is used for the calculation of the covariance matrix, which approximates of the Hessian matrix with a gradient vector – leads to increases the robustness of the model The Kalman filter used in the estimation MSSV model is made path independent which increases the reliability and efficiency of our estimation
  22. Research Contribution (Literature) Each of the state variables incorporate New-Keynesian dynamics with Markov-switching behaviour Decomposition of the performance of models to examine the contribution of the various macroeconomic and non-macroeconomic factors Non-macro factors play a critical role in defining the dependence structures, except for estate-bond and real estate- equity pairs The dependence structure measures go up faster than they go down
  23. Research Contribution (Practice) The bond and gold exhibit counter-cyclical characteristics – provides opportunities for hedging Regime behaviours are different for different dependence structures, thus asset allocation should be aligned to the regime switching behaviour of the dependence structures Bond provides good hedge for oil based securities and gold for equity-based portfolios
  24. Robust Check: Application of Neural Network Research Objective Examine the determinants of the dependence structure in different regimes Fundamentals of Artificial Neural Nets Artificial neural network is a mathematical approach that allows replicating complex non-linear relationships through multiple-nonlinear processing units. These processing units, neurons, map the nonlinear relationship between the input and the output. Learning Process Learning by adaptation Learning Principle: Energy minimization (performance error) Data: US market 987 (3Q)-2012 (3Q), Quarterly data
  25. Artificial Neurons Neurons work by processing information. They receive and provide information in form of spikes. x1 x2 x3 … xn-1 xn w1 Inputs Output w2 y w3 . . . wn-1 wn The McCullogh-Pitts model
  26. Neural Nets Mathematics Input to Hidden Hidden to Output
  27. MLP Neural Network (MLPNN) Model MLP = multi-layer perception Perception: MLP neural network (for Economic Expansion and Economic Contraction):
  28. Learning Optimization Synaptic weight change rules for the output neuron: Synaptic weight change rules for the neurons of the hidden layer:
  29. MLPNN of Joint Dependent Structure Learning = 96%, Testing = 87%
  30. MLPNN Estimation of Joint Dependent Structure
  31. Diagnostic Tests Null: Error is Martingale Correlogram
  32. Thank You
More Related