Download
1 / 39
390 likes | 532 Views
Cambridge Futures. Project Director Professor Marcial Echenique Researcher Rob Homewood Review November 2002 Cambridgeshire Draft County Structure Plan.

E N D
Cambridge Futures Project Director Professor Marcial Echenique Researcher Rob Homewood Review November 2002 Cambridgeshire Draft County Structure Plan
Cambridge Futures is a not for profit organisation established in 1996 by a group of business leaders, politicians, government officers, professionals and academics who have been looking at options for the future of Cambridge. Cambridge Futures Report was published in 1999 alongside a public exhibition, website and videoThe first study of planning options was given the Royal Town Planning Institute Year 2000 Innovation Award.The second study Cambridge Futures 2 focuses on transport and is currently underway.
Review purpose • Cambridge Futures is making submissions to the EiP as an interested party • This section relates to our submission on Issues 5a and 5b and reviews the Deposit Draft Structure Plan from the perspective of the Cambridge Futures Report. • Today’s feedback will be taken on board • The final text of the submissions will be made available.
Issue 5a • Does the Plan set out an appropriate strategy for the overall development of the Sub-Region? • Is the infrastructure to support the strategy deliverable?
Issue 5a Definition of the Sub-Region • Cambridge Futures welcomes the acceptance of the Cambridge Sub-region as a planning area • The Cambridge Futures definition extends into neighbouring counties ( Suffolk, Essex, Hertfordshire) outside the proposed DSP • Is close co-operation with these districts to accommodate growth sustainably possible?
Issue 5a Vision for the Sub-Region • providing space for development recognises the area’s leading role in world research & technology • addresses housing commuting problems aggravated by 50 years of restrictive policy • tries to balance housing near jobs • recognises unique natural environment and built heritage without curtailing prosperity
Issue 5a Overall Numbers • 47,500 new homes 1999-2016 • equivalent building Cambridge city in 17 years • current build rates would need to increase 55% • would not stop cost of living rising (property prices up 19% to 83%) • insufficient densification to contain prices
Issue 5a Growth and Location of Employment • 49,200 new jobs 2001 to 2016 • mainly hi-tech and higher education plus support services • basic sector jobs gravitate towards Cambridge fringes and trunk corridors • service sector jobs increase substantially in Cambridge centre
Figure 2 Employment in edge locations around Cambridge from P Carolin: Cambridge Magazine April 2000
Issue 5a Location of Housing • important to bring houses near jobs for sustainability • sequence corresponds to employment area importance • firstly within Cambridge by Densification • secondly edge city e.g. Northern Fringe, Addenbrookes, University Farm & Airport • thirdly beyond green belt in new settlement or expanded towns
Figure 3 Business Parks in the Sub-Region from Cambridge MIT Institute Urban Design Studio 2002
Issue 5a Economic Impact • proposed house numbers not sufficient to stabilise property prices and cost of living • national planning policies restrict development location and therefore push up prices • land costs now represent over 50% of housing costs ( up from 10% before WWII) • rising property & transport costs inflate salaries, spiralling production costs upward (estimated 17% to 66% by 2016) • regional competitiveness jeopardised unless productivity rises over 2% pa
Figure 4 Export Costs for the Options from Cambridge Futures report 1999
Issue 5a Social Impact • more housing in & around Cambridge reduces social segregation but only small part of allocation • property prices as a proportion of income increased • key workers etc. on nationally fixed salaries suffer most & priced out of city property market • cheaper accommodation retreats further away increasing commuting • social housing dwindling proportion of market • section 106 agreements limited & inefficient answer
Issue 5a Environmental Impact • possibly 24% more trips from 24% more households? • Why Only CHUMMS included as improvement to infrastructure? • max. 25% of new housing in this corridor • remainder areas have no proper infrastructure provision • congestion could increase 200%, waste and pollution • Transport Plan Review needed for new public transport, radial highway capacity, south eastern orbital highway, more park & ride facilities and demand management measures e.g. congestion tolls
Figure 5 Housing Cost and Salaries 1948-1998 from Cambridge Futures report 1999
Issue 5a SUMMARY OF MAIN POINTS • The adoption of the Cambridge Sub-Region as a planning area is welcomed. • The proposed strategy goes a long way to recognise the role of Cambridge as a world leader in research and technology. • The overall housing number allocated is probably not sufficient for the estimated growth in demand. • Location of housing recognises the need to be near jobs. • Economic impact: the cost of living up somewhat and production costs up, due to increased property prices and traffic congestion. • Social impact: probably marginally improved social mix in the Sub-Region. • Environmental impact probably severe, especially due to transport congestion and pollution. Insufficient provision for transport infrastructure to support the strategy.
Figure 6: Comparison of the Options from Cambridge Futures report 1999
Issue 5a Conclusion • reasonable strategy overall in terms of land allocation. • falls short of the optimum for containing property price increases. • would do little to decrease social segregation (and improve housing affordability) but at least it would not make it worse. • biggest problem is the lack of appropriate infrastructure – especially transport – to support the strategy. • proposed increase in transport infrastructure from CHUMMS is limited to one corridor (about a quarter of the Plan). • wishful thinking that no extra transport capacity will be required. • The County needs to confront this squarely with the help of Central Government and develop an appropriate comprehensive transport infrastructure plan, including a package of public-private funding.
Issue 5b • Are the proposals for the distribution of housing within the sub-region appropriate?
Issue 5b Proposed Distribution of Housing • DSP equivalent to selection from Cambridge Futures Study • Futures analysed impacts of options separately & proposed combination promoting equity, efficiency & environment • DSP selections score well on economic efficiency and social equity, less so in environmental quality • Futures results indicative only of scale & direction of impacts • Min Growth & Necklace options rejected by DSP for poor economic & social performance despite positive environmental outcomes
Figure 7 Housing Distribution Compared from Cambridge Futures report 1999 & DSP Policy P9/2
Issue 5b • Location of Housing within the built-up area of Cambridge • c.f. Cambridge Futures Option 2: Densification
Issue 5b • Densification • 8900 dwellings only 40% of Futures scenario • impact probably less than half Futures predictions • least increase in cost of living (19%) as housing located near jobs • relative affordability of housing in Cambridge improves accessibility (say 5%) to all , good for key workers • substantial transport problems from increased population even considering increased cycling (15%) and public transport(100%) • increased traffic delays, cost, energy waste and pollution
Figure 9 Densification: Cost of Living Projection from Cambridge Futures report 1999
Issue 5b • Location of Housing in the edge of Cambridge • c.f. Cambridge Futures Option 4: Green Swap
Issue 5b Green Swap • 8000 dwellings in same locations as Futures scenario but fewer ( Airport, Clay Farm, University Farm & N. Fringe) • Second lowest cost of living increase (30%) • slight decrease in social segregation (2.5%) may help key worker groups • Amongst worst options for congestion • housing relatively close to jobs but combination of increased population & increased travel distances • high increases in traffic delays and pollution • no green swap in DSP i.e. no compensatory public access
Figure 10 Green Swap: Congestion Indicator from Cambridge Futures report 1999
Issue 5b • Location of Housing in a New Settlement • c.f. Cambridge Futures Option 7: New Town
Issue 5b New Town • housing location same as futures scenario but much slower growth (6000 rather than 22,000 by 2016) • Futures showed impacts largely negative everywhere except locally as jobs mostly outside New Town • relatively low cost homes attracts mainly low income population to New Town distorting social mix • St Ives line would improve public transport usage but proximity to jobs in Cambridge still increases car use (60%) • A14 congestion would increase even after CHUMMS • smaller scale possibly still causes over 50% increase in delays and pollution
Figure 11 New Town: Social Group Changes from Cambridge Futures report 1999
Issue 5b • Location of Housing in Market Towns and Rural Locations • c.f. Cambridge Futures Option 5: Transport Links & Option 3: Necklace Development
Issue 5b Transport Links/ Necklace Development • 17000 dwellings in market towns & villages equivalent to Futures options above (22,000 dwellings total) • Cost of living increases around 50% given public transport availability • slight increase in social segregation possible • travel times better than other options if public transport taken up • still marked increased congestion, delays and pollution in Cambridge
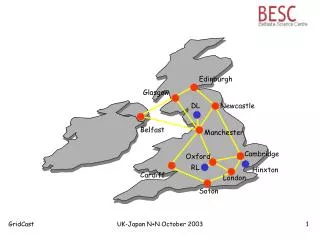
Figure 12 Transport Links: Rail Network from Cambridge Futures report 1999
Issue 5b SUMMARY OF MAIN POINTS • The proposed distribution of housing:- • represents a selected combination of the options explored by Cambridge Futures. • 8,900 housing units within Cambridge (Densification) contains costs, improves social equity but increases congestion. • 8,000 housing units on the edge of Cambridge (Green Swap) also contains costs, marginally improves social equity but substantially increases road congestion. • 6,000 housing units in a new settlement (New Town) increases costs & social segregation and marginally increases the congestion in Cambridge. • 17,000 housing units in market towns and large villages (Transport Links and Necklace) increases costs of production, social segregation but improves travel time only if high quality transport is available. • appears appropriate in terms of economic efficiency and social equity but deficient in terms of environmental quality (insufficient transport capacity provided for new development).
Issue 5b Conclusion 1 • proposed distribution of housing points in the right direction in terms of economic efficiency and social equity • except for new settlement, the distribution tends to limit the increase in cost of living and improve social mix • overall allocation of dwellings is not sufficient to contain the housing price increases & is short of the demand predicted for next 15 years • estimated rise in cost of living of the combined options is around 40%. • allocation would improve marginally the mix of socio-economic groups (easier to accommodate key workers near their jobs).
Issue 5b Conclusion 2 • allocation would substantially increase transport congestion. • CHUMMS will help but not with the difficulties within built up Cambridge. • Traffic delays, time wastage and pollution within built up Cambridge possibly up over 100%. • It is hoped that traffic forecasts of the combined options, as put forward by the County, will be available for the Examination in Public. • increase in pollution is worrying and the reduction of open space can be concern. • Could maintain green wedges connecting the countryside with the city • should strive to keep the best quality landscape and compensate (swap) the land taken for development by public access land. • Need to avoid fringe villages being conurbated into the City.
Next Steps • Consolidation of responses • Update if required of submissions • Presentation at the EiP • Feedback to Cambridge Futures