Download
1 / 59
590 likes | 605 Views
A comprehensive study on the primary recovery, waterflood feasibility, reservoir continuity, and interwell communication in the Eubank Field in Kansas. The study aims to estimate remaining oil-in-place, evaluate potential water injection well locations, and assess the feasibility of secondary recovery methods.

E N D
Eubank Field (Kansas) - A Formation Evaluation and SecondaryRecovery Study Dominique Dexheimer Dr. Thomas A. Blasingame Associate Professor/Assistant Department Head Department of Petroleum Engineering Texas A&M University 12 August 1999
Location of Eubank Field Eubank Field WYOMING IOWA NEBRASKA ILLINOIS UTAH COLORADO KANSAS MISSOURI OKLAHOMA ARKANSAS ARIZONA NEW MEXICO MISSISSIPPI TEXAS LOUISIANA
Issues to be Addressed* • Primary recovery of old and new wells • Remaining oil-in-place/movable oil • Reservoir continuity/reservoir quality • Waterflood feasibility • Reservoir heterogeneity issues • Locations/patterns of water injection wells • Interwell communication via fractures * Terms of Reference—Anadarko Petroleum (April 1998)
Key Findings • Oil-in-place (OIP) • Contacted: 13 million BBL • Movable: 5 million BBL • Remaining: 3 million BBL • Waterflood potential • 3 independent regions: North, South, West • The North region is best in terms of remaining reserves and reservoir quality • Locations/patterns of water injection wells
North Region OIP Results Gregg 2 • OIP computed using production data • Radius of bubble proportional to the value of the variable shown • Wells with no "bubble" indicate that no production data are available • Contacted OIP distribution • North — 10 million BBL • South — 3 million BBL • West — 300,000 BBL West Region Permeability Barrier Moody A-1 Moody A-3 Permeability Barrier South Region
North Region EUR/N Results West Region • EUR/N computed using production data • Note uniformity of EUR/N trends (average of 24 %) Permeability Barrier Permeability Barrier South Region
Owens A-3 Doerksen A1-27 Waterflood Potential (kh, EUR/N) • Patterns developed using IQI, as well as natural flow barriers • IQI=(kh)x(EUR/N) • Predict recovery of 2 to 3 million BBL by waterflood • Almost certainly a low estimate • Repressuring will increase recovery Permeability Barrier (kh, EUR/N, location) Permeability Barrier Leslie 2-33 (kh, EUR/N, location) Leathers Land 1-10 (kh, EUR/N)
Follow-Up (Anadarko) • Economics and Strategy • Must have Section 34 (T28S–R34W) • Water source/water quality • Assess risk involved in initiating and operating a waterflood project in this area • New data acquisition • Pressure transient tests • Geochemistry: source rock, migration • Additional work • Further geologic description of reservoirs • Reservoir simulation
5 Cores 130 ft cored — Owens A-3 Sidewall core data not used in correlations 53 Well logs 1 PVT sample (Owens A-2) 39 Pressure data 12 static bottomhole pressure tests 20 drill stem tests 5 pressure buildup tests 2 other wireline tests 25 Wellbore diagrams Drilling/Completion histories Stimulation treatments 43 Well production records 30 wells — oil allocated(2 wells had limited data) 10 wells — gas allocated 3 wells — unallocated Data Inventory — 55 Wells
1600 1400 1200 1000 800 600 400 Data Inventory Reservoir Pressure History MooA-1 Probable Data Trend for North Eubank Field and 95 % Confidence Interval South Eubank Field Ko1-28 Ko2-28 Su1-28 West Eubank Field Ko_A-4 Pressure, psia Clw1A9 GregF6 MooA-1 Greg_3 Clw1A9 Wr1-26 Su1-28 Legend u DrillStem Test n Static Bottomhole Pressure s Pressure Buildup Test RayC-2 OwnA-1 MooA-3 Clw3-9 Cl2-34 Do1-27 1960 1970 1980 1990 2000 Test date
Legend Oil produced Gas Produced Reservoir Pressure 2 New Wells 8 New Wells 7 New Wells 2 New Wells 2 New Wells 2 New Wells Data Inventory Production History — Oil and GasNorth Eubank Field 5 2000 1800 4 1600 1400 3 Pressure Data Trend 1200 Np, MM BBL Gp, bscf Pressure, psia 1000 2 800 600 1 400 No production given prior to 1970 200 0 0 1960 1970 1990 1980 2000 Time, Years
Legend Oil produced Gas Produced Reservoir Pressure 10 New Wells Data Inventory Production History — Oil and GasSouth Eubank Field 1.0 1800 Pressure Data Trend 1600 0.8 1400 1200 7 New Wells 0.6 Np, MM BBL Gp, bscf 1000 Pressure, psia Outlying pressure data: Clawson Well 3-34 800 0.4 600 400 0.2 200 0 0.0 1996 1997 1998 Time, Years
Enabling Technologies/Data • Core Data (Owens A-3) • Core-Well Log data correlations • pc/kr correlations for effective permeability • Fluid Property Report (Owens A-2) • Well log analysis (53 Wells) • Field cross-section maps • Data used for well performance analysis • Decline type curve analysis (28 Wells) • Mapping/correlation of results
Specific Objectives of this Work • Estimate rock and fluid properties • Estimate contacted and movable OIP • Estimate reservoir continuity • Horizontal flow capacity (koh) • Horizontal/Vertical flow barriers • Evaluate conditions for waterflooding • Reservoir pressure • Completion interval/contacted reserves • Identify potential water injection wells
Results of this Work • Petrophysics • Distributions of rock properties • Core/Well log prediction of permeability • Well Performance Analysis • Distribution of computed variables • Bubble map of OIP and EUR/N • Correlation of volume and flow properties • Waterflood potential • Bubble map of "Injection Quality Index"
Outline - Work Performed by Texas A&M • Geologic Description • Based on literature and Anadarko work • Well Log Analysis (53 wells) • Performed using Petra and SAS softwares • Oil Production Data Analysis (28 Wells) • WPA software • Integration of Results • Confirmed geologic flow model • Recommendations for waterflood • Conclusions
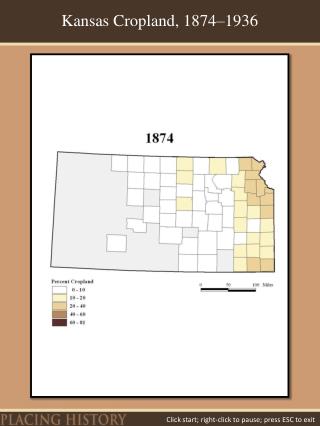
700 ft 9 miles Geologic Description Incised Chester Sand(from 3D seismic structure map) • 3 Producing intervals • Average depth: 5,500 ft • 55 wells drilled • 40 years of production • Np, tot = 2.4 million BBL • Gp, tot = 5.3 bscf • Light oil, sweet gas, water 100<h<300 ft
Perforations Perforations Perforations Incised Chester Sand Geologic Description Schematic of Deposition in a Paleovalley Morrow Notch Sand 3 Shale 2 Sand 2 Shale 1 Sand 1 St. Louis
SP SP SP SP ILD ILD ILD ILD Well Log Analysis Paleovalley Profile—Sample Cross-Section Owens A-3 Owens A-1 Owens A-2 Owens A-4 5300 Morrow Notch 5400 Basal Chester Sand 5500 St. Louis 5600
Well Log Analysis Cluster Analysis (Owens A-3) ILD Log, Cluster Log, SPLog, no units Ohm-m mV 0 10 20 30 40 50 0 1 2 3 4 5 -200 -100 0 5300 Reservoir section is represented by "Cluster" 4 5400 5500 5600
Well Log Analysis Porosity Distribution (from Well Logs) 15 14 Porosity Statistics Average Porosity 13 mean = 0.105 (fraction) Porosity Distribution Function 12 std dev = 0.022 11 10 9 8 Frequency 7 6 5 4 3 2 1 0 0.05 0.06 0.07 0.08 0.09 0.1 0.11 0.12 0.13 0.14 0.15 0.16 f Per-Well Average Porosity, , fraction
Average Volume of Shale Volume of Shale Distribution Function Per-Well Average Volume of Shale, , fraction VSH Well Log Analysis Volume of Shale Distribution (from Well Logs) 16 14 12 Volume of Shale Statistics: mean = 0.082 (fraction) 10 std dev = 0.060 8 Frequency 6 4 2 0 0.04 0.12 0.16 0.08 0.24 0.2 0
14 Per-well Net Pay 12 Net Pay Distribution Function Net Pay Statistics: 10 mean = 20.00 ft std dev = 21.83 ft 8 Frequency 6 4 2 0 5 15 20 25 30 35 40 45 50 55 60 65 70 75 80 85 90 95 10 Per-Well Net Pay, , ft h Well Log Analysis Net Pay Distribution (from Well Logs)
k = 0.2777exp(37.75) 0.00 0.05 0.10 0.15 0.20 0.25 R2= 0.82 Well Log Analysis Core Porosity—Core Permeability Relationship(Owens A-3) 104 Data Trend and 95 % confidence interval 103 102 Core Permeability,k, md 101 100 10 -1 Core Porosity, , fraction
5380 5400 5420 5440 5460 kobs kcal 5480 5500 5520 5540 10-1 100 101 102 103 Well Log Analysis Owens A-3 Core Permeability-Well Log Data Correlation • Tried several models • 3 to 5 well log variables • SP, GR • ILD • NPHI, DPHI, PHIDN True Vertical Depth, ft Legend • "Best" permeability model • Valid for 10<k<200 md • 4 variables (GR, ILD, NPHI, DPHI) • Stable predictor for 45 cases Permeability, md
Well Performance Analysis • Data Required: • Time, pressure, rate (TPR) data • Initial reservoir pressure • Reservoir and fluid properties • How used: • Data edit plot (remove off-trend values) • Decline type curve match • EUR plot • Results: • Flow parameters (kh, s, xf) • Volumetric parameters (N, A)
103 Reservoir Pressure 1000 psia (1986) Gas 102 Flow Rates, BBL/D, Mscf/D Oil 101 Water 100 1985 1988 1991 1994 1997 Production Time, Years Well Performance Analysis Production Data Plot (Moody A-3)
100 qo/Dp, BBL/D/psia 10-1 10-2 102 103 104 105 Np/qo, Days Well Performance Analysis "Data Edit" Plot Moody A- 3 • Only oil cases are relevant for this field • "Data Edit" Plot used to Remove Off-Trend Data
Well Performance Analysis "WPA" Plot (Used to Perform Type Curve Analysis)Moody A-3 1 10 12 7 4 7 4 12 28 18 80 48 800 160 0 1x10⁴ 10 qDdi 80 48 28 18 12 7 4 Dimensionless Rate Functions (qDd, qDdi, qDdid) 160 -1 10 800 qDdid qDd -2 10 -3 -2 -1 0 1 2 10 10 10 10 10 10 Dimensionless Material Balance Time, tDd, days
0.35 0.30 0.25 0.20 q/Dp, BBL/D/psia 0.15 0.10 0.05 0.00 0 100,000 200,000 300,000 400,000 500,000 600,000 Np, BBL Well Performance Analysis Estimated Ultimate Recovery (EUR) Plot Moody A-3 Estimated Primary Movable Oil: 520,000 BBL
103 Reservoir Pressure 770 psia (1995) Gas 102 Flow rates, BBL/D, Mscf/D Oil 101 100 1996 1997 1998 Production Time, Months Well Performance Analysis Production Data Plot Owens A-2
100 q/Dp, BBL/D/psia 10-1 10-2 101 102 103 104 Np/q, Days Well Performance Analysis "Data Edit" Plot Owens A-2 • A unique trend is identified on the plot • Approach tolerates incomplete data
Well Performance Analysis "WPA" Plot (Used to Perform Type Curve Analysis)Owens A-2 1 10 12 7 4 7 4 12 28 18 80 48 800 160 0 1x10⁴ 10 qDdi 80 48 28 18 12 7 4 Dimensionless Rate Functions (qDd, qDdi, qDdid) 160 -1 10 800 qDdid qDd -2 10 -3 -2 -1 0 1 2 10 10 10 10 10 10 Dimensionless Total Material Balance Time, tDd, days
0.250 0.200 0.150 q/Dp, BBL/D/psia 0.100 0.050 0.000 0 10,000 20,000 30,000 40,000 50,000 60,000 Np, BBL Well Performance Analysis Estimated Ultimate Recovery (EUR) Plot Owens A-2 Estimated Primary Movable Oil : 51,500 BBL
Well Performance Analysis Skin Factor Distribution(from Well Performance Analysis) 9 Skin Factor Statistics: Mean = -2.5 Std. Dev. = 1.4 Skin Factor Data Skin Factor Distribution Function 8 7 6 5 Frequency 4 3 2 1 0 -7 -6 -5 -4 -3 -2 -1 0 1 2 Skin Factor, s , Dimensionless
Well Performance Analysis Flow Capacity (koh) Distribution(from Well Performance Analysis) 7 koh Data koh Distribution Function 6 koh distribution Statistics: Mean = 50 md-ft 5 4 Frequency 3 2 1 0 400 0 25 50 75 100 125 150 175 200 225 250 275 300 325 350 375 Flow Capacity, koh, md-ft
8 Fracture Half-Length Data Fracture Half-Length Statistics: Mean = 26 ft FractureHalf-Length Distribution Function 7 6 5 Frequency 4 3 2 1 0 2.1 6.6 44.0 93.8 137.0 200.0 1.0 9.7 64.3 1.5 3.1 4.5 14.1 20.6 30.1 Fracture Half Length, xf, ft Well Performance Analysis Fracture Half-Length Distribution (from Well Performance Analysis)
Integration of Results: Outline • Petrophysical Data • Geologic structure and continuity • Prediction of effective permeability • Well Performance Analysis • Pressure history (used to initialize analysis) • Correlation of koh and N (consistency) • Correlation of EUR and N (primary recovery) • Evaluation for Waterflood • Injection criteria (reservoir properties) • Locations of candidate wells for injection
Integration of Results North Region Geologic Structure/Continuity West Region • 3 independent regions • North, main region • South and dry Southeast tributary • West, minor region • Origin of permeability barriers • Depositional sequences • Block faulting • Morphology of channel • Fluid migration Permeability Barrier Permeability Barrier South Region
Integration of Results Comparison of Effective Permeabilities • Additional Input for koh from well log correlation: • Capillary pressure data • Gas-Oil ratio (3 month avg.) • Comparison on available data (15 Wells) • Reasonable agreement • Divergence due to different depths of investigation • Data shift by a factor of 10 103 LTHA-3 MURD-3 LTHA-2 RAYC-2 OWNA-4 LS2-33 GREGF6 COLA-3 Data trend? TILA-2 102 OWNA-1 TILA-1 DO1-27 KO_A-4 koh (Core-Well Logs Correlation), md-ft MURD-4 RAYC-4 101 100 100 101 102 103 koh (Production Data Analysis), md-ft
North Region Integration of Results Gregg 2 • Contacted OIP distribution • North — 10 million BBL • South — 3 million BBL • West — 300,000 BBL • Remaining movable oil • North — 2 million BBL • South — 625,000 BBL • West — 50,000 BBL • 3 major wells (Np) • Moody A-1 — 235,000 BBL • Moody A-3 — 370,000 BBL • Gregg 2 — 235,000 BBL West Region Permeability Barrier Moody A-1 Moody A-3 Permeability Barrier South Region
1600 MooA-1 Probable Data Trend for North Eubank Field and 95 % Confidence Interval South Eubank Field 1400 Ko1-28 Ko2-28 Su1-28 1200 West Eubank Field Ko_A-4 Pressure, psia Clw1A9 GregF6 1000 MooA-1 Greg_3 Clw1A9 Wr1-26 800 Su1-28 Legend u DrillStem Tests n Static Bottom Hole Pressure s Pressure Buildup Tests RayC-2 OwnA-1 MooA-3 Clw3-9 Cl2-34 Do1-27 600 1960 1970 1980 1990 2000 400 Test date Integration of Results Reservoir Pressure History
Integration of Results Flow Capacity (kh) versus Contacted Oil-in-Place, N • The range of kh-values is uniform, but the spread of N-values has a disconti-nuity caused by differen-tial depletion • Differential depletion is accentuated by pressure declining well below the bubblepoint pressure • The difference between estimated volumes of contacted oil (new and old wells) suggests significant waterflood potential 103 Legend u North Eubank Field ¬ kh = 6 ´10-4N s West Eubank Field DO1-27 n South Eubank Field OWNA-3 1990 OWNA-2 TILA-1 1995 1995 TILA-2 LTHA-3 "New Wells" LTHA-2 1995 RAYC-5 MOOA-1 KO_A-4 1995 MOOA-3 1996 OWNA-4 102 1996 OWNA-1 RAYC-2 1996 1961 1996 1985 1996 1995 1996 RAYC-4 LS2-33 COLA-3 GREGF6 GREG_2 1996 SU2-28 1996 RAYC-3 LS1-33 1996 1996 "Old Wells" 1959 1997 1996 1996 Flow Capacity, koh, md-ft MURD-3 RMRC-2 WR1-26 1997 1964 Incomplete Data 1991 ¬ kh =5 ´10-5N RMRC-1 101 1964 MU1-34 MURD-4 Note Format: Well Code s Completion Date 1985 1997 100 104 105 106 107 Contacted Oil-in-Place, N, STB
Integration of Results Contacted Oil-in-Place (N) versus Estimated Ultimate Recovery (EUR) • Excellent agreement in the computed N and EUR-values • Primary recovery of 24 percent (average for the entire field) • Note that the "old" wells clearly have higher N and EUR—which also vali-dates the "differential depletion" concept 107 Legend u North Eubank Field s West Eubank Field n South Eubank Field MOOA-1 "Old Wells" 1961 MOOA-3 GREG_2 1985 N = 4.2 EUR 1959 106 DO1-27 RMRC-2 OWNA-3 TILA-2 TILA-1 Contacted Oil-in-Place, N, STB 1990 KO_A-4 LTHA-3 1964 1995 LTHA-2 1995 1995 OWNA-4 1996 "New Wells" 1996 1996 OWNA-2 OWNA-1 1996 RAYC-5 1995 1995 COLA-3 105 RAYC-3 MURD-3 RAYC-2 LS2-33 1996 SU2-28 MU1-34 1996 1997 1996 1996 1996 1997 1985 WR1-26 RAYC-4 Note Format: Well Code s Completion Date GREGF6 LS1-33 1991 1996 1996 1996 MURD-4 Incomplete Data 1997 RMRC-1 104 1964 103 104 105 106 Estimated Ultimate Recovery, EUR, STB
Integration of Results Injection Well Criteria • Potential injectors must simultaneously maximize • Access to flow capacity, koh • Primary recovery, EUR/N • Candidates appear on the top right corner of the plot • Criteria to be combined with well locations taken from field maps 0.45 North Region 0.40 COLA-3 0.35 OWNA-1 TILA-2 MOOA-3 0.30 DO1-27 OWNA-2 RAYC-2 TILA-1 OWNA-3 WR1-26 RMRC-2 0.25 RAYC-5 RAYC-4 EUR/N, fraction RAYC-3 OWNA-4 0.20 GREG_2 0.15 RMRC-1 0.10 MOOA-1 0.05 0.00 100 101 102 103 Flow capacity, koh, md-ft
Integration of Results Injection Well Criteria • South and west regions have fewer injection wells based on reservoir quality and movable oil • Alternative injection well locations (green oval) are taken from field maps and the IQI criteria 0.35 South and West Regions 0.30 MURD-3 MU1-34 0.25 LS1-33 LTHA-2 KO_A-4 MURD-4 GREGF6 LS2-33 0.20 EUR/N, fraction SU2-28 0.15 0.10 LTHA-3 0.05 0.00 100 101 102 103 Flow capacity, koh, md-ft
Owens A-3 Doerksen A1-27 Integration of Results (kh, EUR/N) • Patterns developed using IQI, as well as natural flow barriers • Predict recovery of 2 to 3 million BBL by waterflood—from Anadarko study (esti-mate of total recovery) • Flow barriers are well-defined by pressure data • Repressuring should increase recovery Permeability Barrier (kh, EUR/N, location) Permeability Barrier Leslie 2-33 (kh, EUR/N, location) Leathers Land 1-10 (kh, EUR/N)
Integration of Results: Closure • Injection Quality Index, khEUR/N • Limited to available well performance data • Criteria focuses on flow capacity (koh), as well as regions that were well swept (high EUR/N) • Criteria provides optimal sweep of oil to production wells • Well completions • Efficiency of hydraulic fracture is an issue • Interwell communication (fractures, high k zones)
Conclusions • Well log analysis provides comprehensive description of the reservoir • Porosity, shale content, net pay • Approach of core-log permeability correlation • Type curve analysis is a robust tool • Volumetric estimates • Flow parameters • Waterflood potential based on IQI criteria • Injectors location/pattern • Sweep efficiency
Conclusions • Three independent regions (contacted OIP) • North — 75 % of the field reserves (10 MM BBL) • South — 23 % of the field reserves (3 MM BBL) • West — 2 % of the field reserves (300,000 BBL) • Target OIP is 5 million BBL • Primary — 3 MM BBL (24 percent) • Secondary — 2 MM BBL (16 percent)