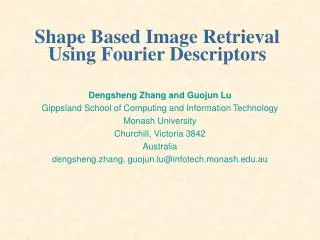
On Using SIFT Descriptors for Image Parameter Evaluation
On Using SIFT Descriptors for Image Parameter Evaluation. Authors: Patrick M. McInerney 1 , Juan M. Banda 1 , and Rafal A. Angryk 2 1 Montana State University, Bozeman, MT 2 Georgia State University, Atlanta, GA. Introduction.


On Using SIFT Descriptors for Image Parameter Evaluation
E N D
Presentation Transcript
On Using SIFT Descriptors for Image Parameter Evaluation Authors: Patrick M. McInerney1, Juan M. Banda1, and Rafal A. Angryk2 1Montana State University, Bozeman, MT 2Georgia State University, Atlanta, GA
Introduction We introduce here a method for image parameter evaluation using Scale-Invariant Feature Transform (SIFT) descriptors and bag of words representation applied to pre-selected image parameters. This method is evaluated against other traditional methods on datasets representing applications in solar image retrieval and other image classification domains.
Motivation The current Content Based Image Retrieval system for the Solar Dynamics Observatory (publicly available at http://cbsir.cs.montana.edu/sdocbir) must search massive databases of image parameter data to find results similar to a query Storage and retrieval efficiency are major concerns Conventional attribute evaluation measures treat spatially organized data as independent, ignoring valuable information Spatial data is common in manyclassification domains – e.g. solar, medical, terrain classification
Outline Image representation for classification SIFT Attribute Evaluation method Testing methodology Attribute evaluation measures tested Testing datasets Results Conclusions
Image Parameter Extraction (1) 64x64 grid for AIA, 32x32 for other datasets
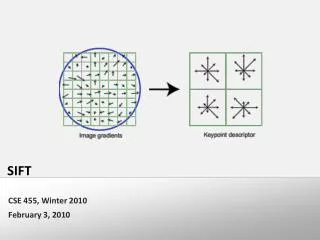
Scale Invariant Feature Transform (SIFT) Developed by David Lowe in 1998
Developed by David Lowe in 1998 Key points identified Picked for stability and invariance to scale and orientation changes Scale Invariant Feature Transform (SIFT)
Developed by David Lowe in 1998 Key points identified Picked for stability and invariance to scale and orientation changes 128-dimensional descriptor is calculated for each key point found. Captures local gradient values around the key point at the perceived scale of the feature Scale Invariant Feature Transform (SIFT)
Bag of Words Comparing SIFT descriptors directly is expensive Solution: Cluster SIFT descriptors to produce visual words K-means clustering used Each individual descriptor is mapped to the most similar cluster center, increasing the word count of that cluster Produces a single vector for each image
SIFT Attribute Evaluation Extract SIFT descriptors from parameter images Construct Bag of Words representations using 20,50,and 100 words Classify each Bag of Words model for the parameter, average accuracy results to produce the measurement used to rank that parameter
Other AE methods χ2– Statistical test for independence of variables Low probability of independence between attribute and class implies good candidate Information Gain – measures how much class entropy is reduced by knowledge of an attribute Gain Ratio – Info Gain divided by Intrinsic Value of attribute Compensates for Info Gain's tendency to prefer complex attributes
Datasets Variety of image types to test in broad range of applications 2 solar, 2 medical, 3 natural scene, 1 indoor environment 1 label per image, all classes evenly balanced 6 x 298 for AIA, 8 x 200 for others Color images converted to greyscale
Solar Datasets • Taken from Transition Region And Coronal Explorer (TRACE) and Solar Dynamics Observatory (SDO) missions • TRACE images are closeups of single solar phenomena • For SDO we use full solar disk images taken by Atmospheric Imaging Assembly (AIA) instrument • Labeling for AIA images culled from the output of dedicated event detectors recorded in the Heliophysics Event Knowledgebase (HEK)
Other Data Sets Pulled from various image retrieval conferences and research institutions Cover potential non-solar applications
Evaluation Methodology (1) Extract the 10 parameters from each of our images Classify each dataset using the individual 1024-dimension (32x32 grid) parameter vectors to represent the image Use two standard high performance classifiers: Support Vector Machine (SVM) and Random Forest (RF) Run SIFT AE, as well the other three attribute evaluation methods
Evaluation Methodology (2) Compare which parameters are suggested by each method against the how well each parameter actually classifies the data Use Inversion Number to quantify the comparison
Inversion Number All four methods produce rankings of attributes We need to compare these rankings to the correct ranking of attributes, based on how well each attribute actually classifies the data Use Inversion Number (IN) Count for all pairs in sequence which are out of relative order Ex: [1,4,3,5,2] (2,3),(2,4),(2,5),(3,4) are out of order IN = 4 Equal to the number of adjacent swaps required to sort the list
Results Highlight - TRACE (Smaller IN = better)
Results (Smaller IN = better)
Results (Smaller IN = better)
Results (Smaller IN = better)
Results SIFT: 14.25X2: 19.5Info Gain: 18.5Gain Ratio: 16.5Overall: 17.19 Average SVM IN values SIFT: 15.125X2: 11.875Info Gain: 11.125Gain Ratio: 12.125Overall: 12.5625 Average RF IN values (Smaller IN = better)
Results (Smaller IN = better)
Conclusions Did very well on TRACE and medical data, for which the image parameters were selected Other parameters should be tried to study behavior Wasn't better than traditional methods for AIA A concern for SDO CBIR Region based representation / retrieval should help Did surprisingly well on INDECs New domain applicability
Future Work Explore SIFT AE in other domains and with other parameters Other astro data SuperCOSMOS Sky Survey Galaxy Zoo Mergers project Ideas welcome
Medical CLEF – information retrieval conference Medical component of their image track, ImageCLEFmed Radiographs of the human body, manually annotated for machine learning Images drawn from 2005 and 2007 versions of the dataset