Download

1 / 21
210 likes | 315 Views
Understand the results from data tables and graphs, discuss trends and unexpected data, conclude findings, relate to hypothesis and background, suggest improvements, present on a display board effectively.

E N D
Data Analysis, Conclusion, Final Paper and Display Board NMS 2013-2014
Data Analysis • Data analysis is explaining the results from your data tables and graphs in words. This is where you put into words what happened in the experiment. In your analysis you will want to: • Discuss the average results from each experimental group. • Discuss the overall results of each trial, especially if it differed from other trials. • Mention any unexpected or outlying data (but not why you think you got those results). • Identify overall trends in both the data tables and graphs.
Conclusion • In your conclusion, you should discuss: • Whether your hypothesis was accepted, rejected, or inconclusive. • How the actual results compared to the expected results • Were there factors that could have affected the results of your work? • How might they have affected them? • How your results relate to the background information you found on your topic. Did your results match your background information? • How the experiment could be changed to study the issue better or in more detail. • How your experiment relates to everyday life
Final Paper • Everything in your log book will now be typed up as a written paper. • Each section in your log book will be a section in the paper. Refer to the science fair packet for the correct order. • All items except data tables and graphs should be written in complete sentences. • If you have hand written data tables you may refer to them in your paper and state that they can be found in your log book rather than re-copying. • If data tables are typed, you may include them in you paper. • Please refer to rubric for specific information on what is required for each section.
The Display Board • You will present your project on a tri-fold board. If selected for the school science fair, you board and the components of your project binder will be on display in the media center. • The display should look interesting and be inviting to the observer, with all necessary information presented clearly. The board can be made or purchased in standard size, not to exceed the following dimensions: 76 cm deep, 122 cm wide and 274 cm high • Do NOT print your report and throw it on the board! It should look interesting and inviting!
Goals of a Project Display Board • Provides judges and the public with an overview of your project when you are not there to explain • Emphasizes succinctly the scope of the project, the nature of the research, and the results • Demonstrates your authority as a researcher by the neatness and correctness of the information presented 2012 Science Fair Professional Development Series
Examples of Tabletop Displays 2012 Science Fair Professional Development Series
Guidelines • Keep the display simple. Avoid clutter. Judges and the public viewing the board must be able to comprehend quickly what your research involved. • Arrange the information logically. • Label all data tables, charts, graphs, or photographs you use. 2012 Science Fair Professional Development Series
Cautions About PowerPoints, Videos, & Digital Photoframes • PowerPoints and videos can be excellent complements to the text and graphics on a project board. However, they should not be the sole presentation of the project for the following reasons (additionally, power is not provided): • PowerPoint and Video presentations must be reviewed for content. If there are any major violations in the content, it may be too difficult to make changes in time for judging • Judges or the public seldom take the time to view the whole presentation 2012 Science Fair Professional Development Series
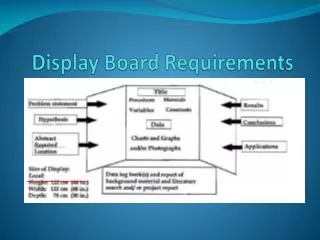
What the Board Should Display • Purpose • Hypothesis • Materials • Procedure • Title (Keep it Simple) • Graphs • Pictures • Data • Results • Conclusion • Abstract • Other Required Paperwork 2012 Science Fair Professional Development Series
The Project Title • Keep it simple and short. It should be readable from a minimum of six feet. • Try to develop a phrasing that captures attention but succinctly represents your research. • The title should make the casual observer want to know more. 2011 Science Fair Professional Development Series
Keys to Good Displays • Make sure your display follows a sequence and is logically presented and easy to read. Reach out to the ‘skim-reader’. • A glance should permit anyone (particularly the judges) to locate quickly the title, abstract, experiments, results and conclusions. • When you arrange your display, imagine that you are seeing it for the first time. • Highlight your results using key graphs that show the relationships of the two variables tested. Use the graphs to give a ‘picture’ of the data for your viewers. These graphs will provide an easier method of viewing the data rather than just seeing the recorded quantitative data. 2012 Science Fair Professional Development Series
Make it POP! • Make your display stand out. • Use neat, colorful headings, charts and graphs to present your project. • Pay special attention to the labeling of graphs, charts, diagrams, photographs, and tables to ensure that each has a title and appropriate label describing what is being demonstrated. • Anyone should be able to understand the visuals without further explanation. 2012 Science Fair Professional Development Series
Not Allowed for Display Containers of plants and dirt not allowed. Glass items not allowed. 2012 Science Fair Professional Development Series
Not Allowed for Display Plant, seeds and other dried materials scattered for Decoration. Chemical or chemical compounds (including water). Sharp objects, such as this needle, or weapons, combustibles, of other hazardous devices. 2012 Science Fair Professional Development Series
Not Allowed for Display • If your display includes an electrical or engineering design , make certain that there is no exposed wiring and connections without non-conducting shielding or a grounded metal box or cage. • The project to the right illustrates a display that would not be approved. 2012 Science Fair Professional Development Series
How to Credit Photos & Images • Any photos, images, and graphs used in the display must be credited. If the finalist created all photos/images, a single credit is sufficient. • Photos of human subjects must have consent/release forms. 2012 Science Fair Professional Development Series
Photo Release – Consent Form Display of photographs other than the student researcher must have a photo release signed by the subject, and if under 18 years of age, also by the guardian of the subject. These forms should not be displayed in order to protect the anonymity of human subjects but must be available for the inspector to check. Sample Text for a Release/Consent Form I consent to the use of visual images (photos, videos, etc.) involving my participation/my child’s participation in this research. __________________ Signed 2012 Science Fair Professional Development Series
Please Note! In the end… The judges are judging your research, not the display. Do a good job, but don’t spend an excessive amount of time or money on the board. You are being judged on the science not the show! 2012 Science Fair Professional Development Series
Let’s take a look at the rubric: • Table of contents example: Section Title……………………….Page Number • Background Research………………………..2 • Purpose/Question…………………………....5 • Hypothesis……………………………………..5 • Variables………………………………………..5 • Materials………………………………………..6