Access and Analyze Environmental Data: Live Access Server Overview
The Live Access Server (LAS) provides a powerful framework for displaying, analyzing, and distributing environmental data. Users can seamlessly access local and remote datasets served via OPeNDAP and the netCDF API, ensuring compatibility with CF metadata conventions. LAS offers customizable plotting options, including dynamic color scales and tailored plot types. Users have the ability to perform various statistical analysis operations and create side-by-side comparisons of different datasets. Additionally, data can be downloaded in multiple formats, and LAS includes custom user interfaces for enhanced data visualization.

Access and Analyze Environmental Data: Live Access Server Overview
E N D
Presentation Transcript
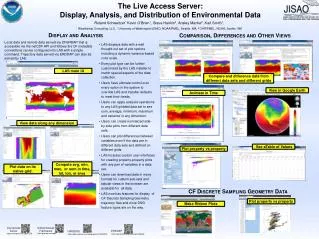
The Live Access Server: Display, Analysis, and Distribution of Environmental Data Roland Schweitzer* Kevin O'Brien1, Steve Hankin2, Ansley Manke2, Karl Smith1, *Weathertop Consulting, LLC, 1 University of Washington/JISAO, NOAA/PMEL, Seattle, WA, 5 OAR/PMEL, NOAA, Seattle, WA Display and Analysis Comparison, Differences and Other Views Local data and remote data served via OPeNDAP that is accessible via the netCDF API and follows the CF metadata conventions can be configured into LAS with a simple command. Trajectory data served via ERDDAP can also be served by LAS. • LAS displays data with a well thought-out set of plot options including a dynamic variance-based color scale. • Every plot type can be further customized by the LAS installer to match special aspects of the data collection. • Users have ultimate control over every option in the system to override LAS and installer defaults to meet their needs. • Users can apply analysis operations to any LAS gridded data set to see sum, average, minimum, maximum and variance in any dimension. • Users can create normalized side-by-side plots from different data sets. • Users can plot differences between variables even if the data are in different data sets and defined on different grids. • LAS includes custom user interfaces for creating property-property plots with any pair of variables in a data set. • Users can download data in many formats for custom sub-sets and tabular views in the browser are available for all data. • LAS now has features for display of CF Discrete Sampling Geometry trajectory files and more DSG feature types are on the way. LAS main UI Compare and difference data from different data sets and different grids View in Google Earth Animate in Time Trackline of Drifter SLP August, 2011 OSMC data and products may be viewed on Google Earth View data along any dimension See aTableof Values Plot property vs property Compute avg, min, max, or sum in time, lat, lon, or area Plot data on its native grid. CF Discrete Sampling Geometry Data Plot property vs property Make Ribbon Plots Live Access Server Unified Access Framework ERDDAP THREDDS http://coastwatch.pfeg.noaa.gov/erddap/ http://ferret.pmel.noaa.gov/LAS http://geo-ide.noaa.gov/ http://www.unidata.ucar.edu/projects/THREDDS/