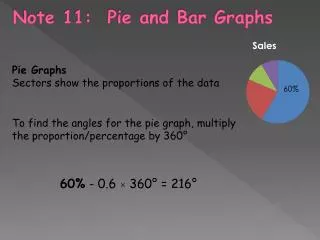
Pie Graphs
Pie Graphs. Noah Holihan and Kyle Wang. What is a Pie Graph?. A pie graph is a type of graph in which a circle is divided into sectors that each represent a proportion of the whole. This graph would be chosen if you would wanted to see the percentage of a whole group. Example.


Pie Graphs
E N D
Presentation Transcript
Pie Graphs Noah Holihan and Kyle Wang
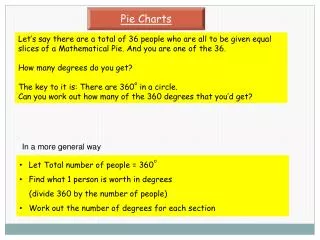
What is a Pie Graph? A pie graph is a type of graph in which a circle is divided into sectors that each represent a proportion of the whole. This graph would be chosen if you would wanted to see the percentage of a whole group.
Example http://www.webquest.hawaii.edu/kahihi/mathdictionary/C/circlegraph.php
Data The data that is necessary to make the graph is the total number of the certain subject and the total number for each sector in order to find the percentages for the graph.
Explanation Step 1: Collect data from students in Honors Algebra Step 2: Put data into Microsoft Excel and create a pie graph with the percentages Step 3: Transfer pie graph from excel onto the PowerPoint document Step 4: Label each section correctly with each category
Problem If ten more students came into the class how many would you expect to play at least three sports in a year?
Advantages Advantage 1: You can visually see how many sports are played in a year by the students of Honors Algebra. Advantage 2: Easy to compare each section with one another.
Disadvantages Disadvantage 1: Not easy to compare with other types of data. Disadvantage 2: Does not work with all types of data. Ex: y=2x+4
Bibliography • http://www.google.com/search?hl=en&safe=active&q=pie%20chart%20definition&bav=on.2,or.r_gc.r_pw.r_qf.&bvm=bv.42080656,d.dmQ&biw=1024&bih=673&wrapid=tlif136059830962411&surl=1&um=1&ie=UTF-8&sa=N&tab=iw&ei=7hUZUbmbOJLO0QHhuIHwCA • http://www.webquest.hawaii.edu/kahihi/mathdictionary/C/circlegraph.php