Active Beam Spectroscopy For ITER
360 likes | 377 Views
Explore the principles, software packages, and instrumentation for active beam spectroscopy in ITER fusion reactor. Learn about spectral analysis, error studies, and impurity description. Collaborate with experts at international conferences.

Active Beam Spectroscopy For ITER
E N D
Presentation Transcript
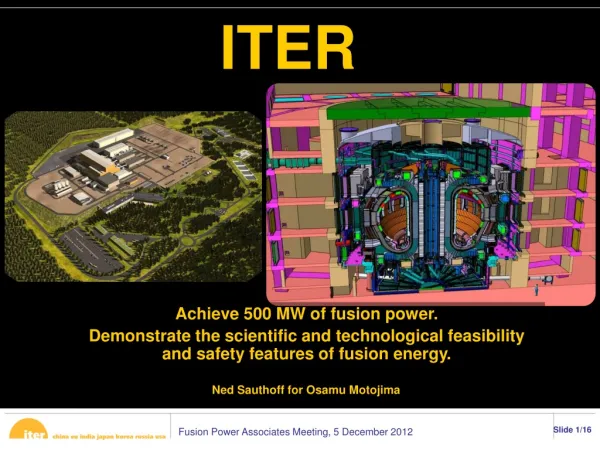
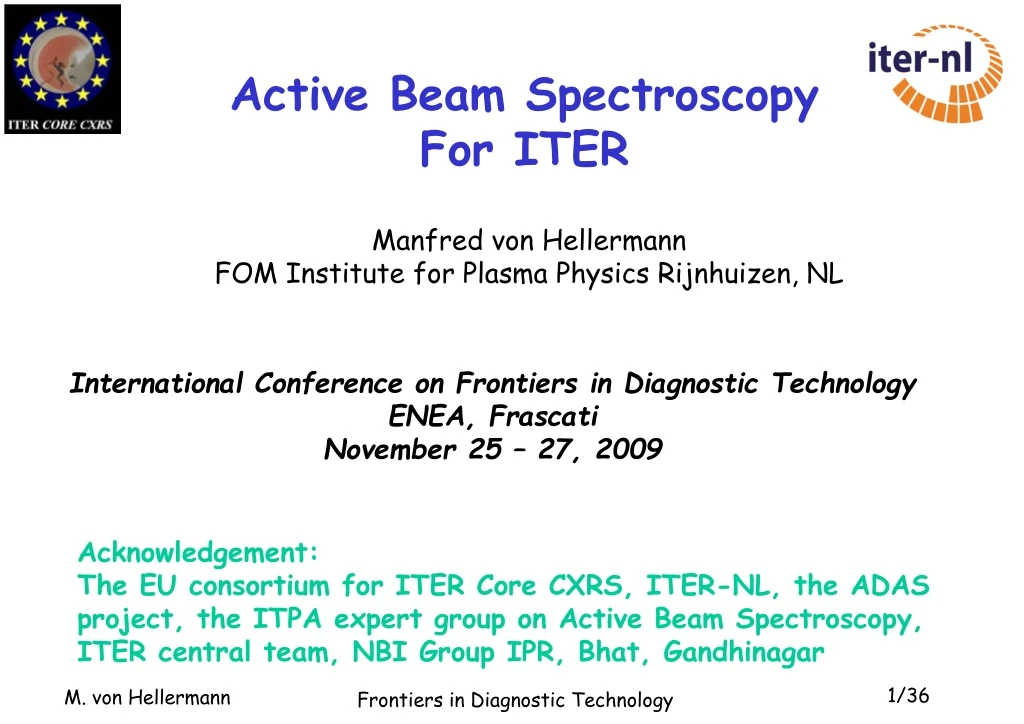
Active Beam Spectroscopy For ITER Manfred von Hellermann FOM Institute for Plasma Physics Rijnhuizen, NL International Conference on Frontiers in Diagnostic Technology ENEA, Frascati November 25 – 27, 2009 Acknowledgement: The EU consortium for ITER Core CXRS, ITER-NL, the ADAS project, the ITPA expert group on Active Beam Spectroscopy, ITER central team, NBI Group IPR, Bhat, Gandhinagar Frontiers in Diagnostic Technology
Outline • Basic concepts of active beam spectroscopy (CXRS+ BES) • Software Packages • Spectral Analysis Code • Inverse reconstruction Code • Forward Simulation Code • CXRS and BES for ITER making use of DNB & HNB • Non Thermal Slowing-Down Features • Instrumentation and Port-plug development Frontiers in Diagnostic Technology
Quantitative Spectroscopy and all that …. Accompanying Software Packages ADAS membership (http://adas.phys.strath.ac.uk) ITER joint ADAS in 2009 See also H.P.Summers et al. and O.Marchuk et al. this conference Frontiers in Diagnostic Technology
Active Beam Spectroscopy (basic principles) • localized measurement • quantitative use of intensities • intrinsic consistency of temperature, rotation and density • advanced collisional radiative atomic modelling • beam emission spectroscopy as indispensable collateral to CXRS Frontiers in Diagnostic Technology
Spectral analysis Code “CXSFIT” CHarge Exchange Analysis Package “CHEAP” Spectral Prediction Code “CX-simulation” Spectrum parametrisation of active and passive features extraction of physics parameters: Ti, vrot, Icx and Icont derivation of ion densities via atomic rates and donor densities Global consistency checks Frontiers in Diagnostic Technology
Forward prediction of Active Spectra Fusion Device Impurity description Prediction of active and passive Spectral Features Signal-To-Noise Parameter retrieval Error studies Target Plasma Neutral Beam Instrumentation Frontiers in Diagnostic Technology
CX Simulation package, contact mgvh@rijnh.nl http://www.rijnhuizen.nl/users/cxrsmgvh/simuserpackage Frontiers in Diagnostic Technology
Error Analysis for CVI (1%), U-port-3, t=100ms, DNB: P=3.6MW, E=100keV/amu, 7mrad Frontiers in Diagnostic Technology
ITER CXRS measurement requirement table Frontiers in Diagnostic Technology
Full grid simulation of ITER DNB MSE spectrum Frontiers in Diagnostic Technology
MSE and CXRS on D error analysis Finite-Grid-Beam-Model, DNB modulated Local Fuel mixture measurement for r/a>0.2 Frontiers in Diagnostic Technology
Scan of Fuel mixture, Error analysis for full grid model r/a=0.3, 3.6MW DNB modulated, t=100ms Frontiers in Diagnostic Technology
Non-Thermal CX features In collaboration with E.Delabie, FOM, Rijnhuizen F.Orsitto, R de Angelis ,ENEA Frascati Frontiers in Diagnostic Technology
Fast Ion Spectra Modelling DEfast>> DE(Qeff) • Slowing-Down-Alphas (DNB & HNB) • 20 keV< E < 3.5 MeV • Do+He+2(E) D++He+1,*(E) • 2) Fast Beam Ions • DNB: E< 100 keV, HNB : E < 1 MeV • Do+D+(E) D++D0,*(E) Frontiers in Diagnostic Technology
a-Source rate: slowing-down time: critical velocity: Isotropic Alpha particle Slowing-Down-Function Frontiers in Diagnostic Technology
r/a=0.3 Active thermal and non-thermal CX Alpha particle features, no background Frontiers in Diagnostic Technology
Broad-band Alpha-Slowing-down Spectrum (DNB) Detection limit set by instrumentation • E=100keV/amu • = 100msec F =1.8 D =30A/mm Dl=30A Frontiers in Diagnostic Technology
Using the HNB as potential source for Slowing-Down alphas and Broad-band CXRS spectra E=0.5MeV/amu P=18 MWatt Negative ion source 10 mrad divergence DC operation Frontiers in Diagnostic Technology
CX Simulation package, contact mgvh@rijnh.nl http://www.rijnhuizen.nl/users/cxrsmgvh/simuserpackage Frontiers in Diagnostic Technology
Alpha Slowing Down spectrum using HNB and MSE E-port t=100msec, Kaiser spectrometer F1.8, D=30A/mm, slit 2mm Frontiers in Diagnostic Technology
r/a>0.2 Aims and Expectations for ITER: Charge eXchange Recombination Spectroscopy: 1) Helium ash measurement 2) Impurity ion densities 3) Ion temperature 4) Plasma rotation 5) Fuel mixture and density 6) Slowing-Down spectra using HNB Frontiers in Diagnostic Technology
Active Beam Spectroscopy • Upper port (UP3): • Core CXRS (EU) • BES (In) • (MSE, fBES) • Equatorial Port (EP3): • Edge CXRS (RF) • MSE on HNB (US) • (fBES) • DNB: 100 keV,H, 36 A Frontiers in Diagnostic Technology
Diagnostic beam for ITER: E=100keV/amu, P=3.6MW, div=7 mrad, modulation 5Hz IPR, Bhat, Gandhanigar 19m Dan Thomas, Robin Barnsley, Beatrix Schunke, Chris Walker, ITER CT Frontiers in Diagnostic Technology
Courtesy: Mahendrajit Singh, IPR, Gandhinagar, India Frontiers in Diagnostic Technology
Tilt of DNB by 6o avoiding trapped particles 4.4 degrees by re-shaping of the East column, 1.6 degrees by blanket aperture West shift, 6 degrees total Courtesy: N.C.Hawkes, CCFE, UK, B.Schunke, ITER Central Team Frontiers in Diagnostic Technology
Beamlet divergence 7 mrad DNB Ion grid assembly and throughput limitation by blanket duct size, changed to 300mmx450mm) Courtesy: Mahendrajit Singh, IPR, Gandhinagar, India Frontiers in Diagnostic Technology
Port plug and components: Conceptual design activity and R&D • Design solutions for: • Mirror mounts • Shutter • Retractable tube • 2ndary mirror mounts • shielding modules • Plug shell structure • Analysis / calculations: • Optical • Structural analysis • Electromagnetic loads • Cooling / hydraulic • Neutronics / nuclear heating Courtesy: W.Biel ,FZ-Juelich Frontiers in Diagnostic Technology
Port plug and components: Design and R&D (cont‘d) Design of a shutter for the 1st mirror Integration Neutronics analysis Optical design of mirror labyrinth Frontiers in Diagnostic Technology
High etendue 4-channel spectrometer for ITER core CXRSdevelopment project with partners from industry Target specifications: Input f-number defined by fibre output: f/2.27 (1 spectrometer for each radial channel) extremely demanding combination of etendue, resolution R = 6000 and efficiency … however required to achieve sufficient measurement accuracy, W.Biel, Jaipur 2008 Frontiers in Diagnostic Technology
Spectrometer design considerationsW.Biel, Jaipur 2008 • Available cameras with efficiency > 80%, frame rate > 100 /sec, high full well capacity • Detector area 13 mm x 13 mm or 26 mm x 6-8 mm (vertical binning) • Possible camera development for the case 30 mm x 30 mm • Echelle grating in Littrow configuration: • low diffraction order (m < 20) compatible with wide free spectral range • Groove density m*G 2500 … 5000 / mm • Focal length f 150 … 300 mm • Incidence angle 50 … 75 degrees • F-number F 1 • Order sorting needed by second dispersive element (e.g. interference filters or 2nd grating with dispersion direction in different orientation) Frontiers in Diagnostic Technology
High etendue spectrometer: design proposal by Lasertechnik / ISAS objective objective objective objective camera camera camera camera grating 4 grating 3 grating 2 grating 1 649 nm–663 nm slit slit slit slit 562 nm–571 nm 518 nm–534 nm 460 nm–474 nm Fibre from experiment Detector used: 30 mm x 30 mm area Spectral line width achieved: ~ 0.1 nm Size of the instrument: ~ 1.5 m x 1.5 m Frontiers in Diagnostic Technology
High etendue spectrometer: design proposal by Lasertechnik / ISAS: Details Separation of bands by interference filters: Objective design for Littrow spectrometer Frontiers in Diagnostic Technology
High etendue spectrometer: design proposal by GWU/Systematix: ITER CXRS Proposal 1 Sensor surface GRISM Order-sorter Field corrector Mirrors separating spectral bands (orders 13,15,16 and18) to each camera Echelle grating Folding mirror Collimator Entrance fiber bundle Main focusing lens assembly Secondary relay lens assemblies, one for each camera Detector used: 26 mm x 6.4 mm area Spectral line width achieved: 0.1 … 0.13 nm Size of instrument: 3.1 m x 1.5 m P. Lindblom Frontiers in Diagnostic Technology
High etendue spectrometer: design proposal by Dutch Space: J. Doornink , R. Vink et al. Frontiers in Diagnostic Technology
Channel 1 Dichroic Channel 2 Grating Input slits Dichroic Channel 3 Channel 4 Frontiers in Diagnostic Technology
Summary remarks • Active Beam Spectroscopy offers a rich diagnostic potential • for ITER • Substantial progress has been achieved in a quantitative • analysis of active spectra ,DNB development and port-plug designs studies • 4 ITER partners are involved EU, RF, IN ,USA • Active Beam Spectroscopy for ITER remains a challenging task. Both in technological and physics ingenuity ! Frontiers in Diagnostic Technology