Download
1 / 1
10 likes | 101 Views
This study examined the spatial and temporal distribution of decapod zooplankton in Estero Bay, Florida, from 2005 to 2006. Freshwater inflows influenced the distribution, with different species showing associations with salinity levels. Results revealed community structure differences based on salinity influence. The study emphasizes the importance of freshwater inflows in shaping decapod zooplankton communities in estuarine environments.

E N D
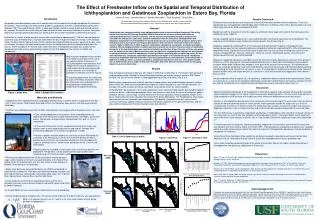
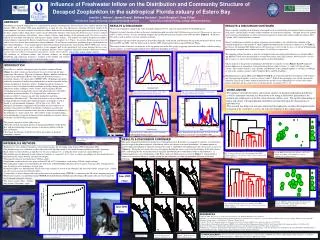
Influence of Freshwater Inflow on the Distribution and Community Structure of Decapod Zooplankton in the subtropical Florida estuary of Estero Bay. Jennifer L. Nelson1, James Evans1, Bethany Bachelor1, Scott Burghart2, Greg Tolley1 1 Florida Gulf Coast University, Coastal Watershed Institute 2University of South Florida, College of Marine Science ABSTRACT Distribution of decapod zooplankton was examined both spatially and temporally. Sixteen stations were sampled monthly, from January 2005 to December 2006, using plankton tows at open bay sites, near tidal passes, and along the lower reaches of the main tributaries. Seasonal variability of freshwater inflows influence the distribution of decapod plankton in the bay by dictating the bay’s salinity regime, which affects various species differently. Densities of the mud crab, Rhithropanopeus harrisii, indicate a geographical association with tributary (lower salinity) stations, while densities of the porcelain crab, Petrolisthes armatus, indicate an association with open bay and near-pass (higher salinity) stations. The majority of common decapod taxa exhibit a central tendency (measured by density-weighted mean salinity of capture) of 30 psu. In contrast, Rhithropanopeus harrisii and Sesarma reticulatum show much lower central tendencies, 12 and 26 psu, respectively, explaining in part, the differences in their spatial abundances. A one month temporal shift in the initiation of peak density occurred from 2005 to 2006 for R. harrisii, P. armatus, and E. depressus, and is reflective of the temporal shift in the initiation of wet season between the two years. Multivariate statistical analysis of the larval decapod densities reveal significant community structure differences between stations within the influence of high-flow tidal tributary stations (lower salinity), and all other stations (higher salinity). RESULTS & DISCUSSION Of the total zooplankton caught in the study, decapods comprised 87.5%, and were represented by 41 identified species. Temporal (seasonal) densities of three of the most abundant decapod taxa in the study, Rhithropanopeus harrisii, Eurypanopeus depressus, and Petrolisthes armatus, reveal a one month temporal shift in the pattern of peak densities from 2005 and 2006. Figures 2 – 4 illustrate this shift as well as distinct seasonal variations in density. Figure 5 depicts the daily inflow estimated for Estero Bay during the study period, and illustrates the lag in the initiation of the wet season between 2005 and 2006. Note the inflow peak in October 2005, which captures the passage of Hurricane Wilma. The temporal shift in densities are reflective of the lag pattern seen in the flow graph, suggesting that freshwater inflows, and the resulting salinity regimes, are influencing decapod densities differently depending on the taxa. RESULTS & DISCUSSION CONTINUED Species-specific variability in distributions of decapod larvae is related to the physiological salinity tolerances of each species, and the highly variable salinity conditions of estuarine environments. Decapod larvae rely on both active internal osmoregulation as well as behavioral responses to unfavorable salinity conditions (Anger, 2001; Capaldo, 1993) to deal with that variability. Density-weighted mean salinity of capture (organism central tendency) was calculated for a number of the common decapod taxa, the majority of which exhibited distributions that centered at salinities of 30 (Table 1). In contrast, the dominant LSZ habitat species, Rhithropanopeus harrisii and Sesarma reticulatum both had much lower density-weighted mean salinities of capture, 12 and 26 psu, respectively. The sampling stations located in or near the two highest freshwater inflow tidal tributaries (i.e. Imperial River and Mullock Creek) were characterized as seasonal low salinity zone (LSZ) habitats. Rhithropanopeus harrisii and Sesarma reticulatum were the dominant species in these LSZ habitats. Cluster analysis of decapod larval abundances for both the wet and dry seasons (Figures 8 and 9) indicated distinct differences in community structure between the low salinity stations (1, 2 and 9, 10) and all other stations. The northern stations 1 and 2 (Hendry and Mullock Creeks) grouped together as a distinct assemblage, as well as the southern stations 9 and 10 (Imperial River and Fish Trap Bay). Multidimensional scaling (MDS) plots (Figures 10 and 11) also demonstrated these distinctions, with stations 1 and 2 being grouped together, as well as stations 9 and 10. Both of these groupings were clearly separated in ordination space from all other stations in both the wet and dry season although the wet season shows much greater distinction and has a lower stress level than the dry season plot (.08 vs .15). The influence of freshwater inflow, and resultant salinities, on decapod distribution and community structure is strongest in the northern and southern portions of the Bay where the largest freshwater inflows exist. • INTRODUCTION • Estero Bay is a shallow, subtropical estuary located in southwest Florida (Figure 1), where seasons are dictated more by cycles of wet and dry than temperature fluctuations. There are 5 tributaries (Hendry, Mullock and Spring Creeks, Estero and Imperial Rivers) that drain into Estero Bay from its watershed, which is 345 square miles (CHNEP, 2005). Hydrologic alterations within the watershed of the Bay have changed the size of the watershed and the amount and timing of freshwater inflows. Significant land use changes in recent years have also altered freshwater inflows to the Bay through increased impervious surface, leading to a more “flashy” inflow regime to the Bay. Continuing increases in impervious surface and urban land cover will further alter inflow regimes to the Bay. It is recognized that such changes in freshwater inflow to estuaries can alter their productivity and biotic communities (Browder, 1991). The value of estuaries as nursery habitats and feeding grounds for commercially important species of decapods as well as finfish is well documented (Schmitten, 1999 & Day et al., 1989). The biological and economic significance of Estero Bay has led to efforts to set minimum flows and levels (MFLs) for the Bay’s tributaries as well as the development of several restoration efforts that aim to return flow conditions in the tributaries to a more natural state. These efforts require an understanding of the relationships of specific freshwater inflow conditions to sensitive subsets of the Bay’s overall biological community. • The primary objectives of this study were to: • Describe seasonal and spatial patterns of decapod distributions within Estero Bay, and the relationships of those patterns to freshwater inflows from the Bay’s tributaries. • Investigate the influence of freshwater inflow and salinity on decapod community structure. • CONCLUSIONS • The influence of freshwater inflow and resultant salinities on decapod zooplankton distributions, as well as community structure, has been shown to be strong in Estero Bay, particularly in the northern and southern parts of the Bay where the largest inflows exist. The specific relationships of inflow and salinity to decapod plankton distribution are dependent upon the characteristics of individual taxa. • This research may help water managers understand the implications of further development and/or restoration of the watershed, as well as aid in the development of flow regime targets. Fig. 2: Seasonal use of Estero Bay by zoeae of the flatback mud crab Eurypanopeus depressus Fig. 3: Seasonal use of Estero Bay by zoeae of green porcelain crab Petrolisthes armatus Fig. 4: Seasonal use of Estero Bay by zoeae of the Harris mud crab Rhithropanopeus harrisii Fig. 5: Estimated Estero Bay daily inflow. Note the one-month lag in the on-set of the wet season from 2005 to 2006. Fig. 1: Map of Estero Bay, including locations of sampling sites and tributaries RESULTS & DISCUSSION CONTINUED The spatio-temporal distribution of specific taxa of decapod larvae in Estero Bay, as compared to salinities, reveals patterns that also suggest the influential power of freshwater inflow and salinity on decapod distribution. A common pattern of spatio-temporal distribution of organisms found in this study is exhibited by the flatback mud crab, Eurypanopeus depressus (Figure 6). During the wet season, the center of organism distribution moves away from the influence of the tidal tributary flows, and during the dry season the center of organism distribution moves toward the mouths of tidal tributaries. A contrasting pattern is seen with densities of the Harris mud crab, Rhithropanopeus harrisii (Figure 7), which exhibits a pattern of association with lower salinities within the tidal tributaries or within the immediate influence of the tidal MATERIALS & METHODS • Plankton tows were conducted monthly at sixteen fixed stations, for 24 months, from January 2005 to December 2006. • The plankton tows were conducted on flood tides with a 500 μm Nitex mesh, 0.5 m mouth diameter plankton net, with a flowmeter. • Each station was located either an open bay site (8), near a tidal pass (3), or along the lower reaches of a main tributary (5) • The plankton net was deployed at each station for 5 minutes at a speed of 1.0 to 1.5 m/s as a three step oblique tow that divided the net’s time between the surface, bottom, and mid-water depths. • Water quality data was recorded using a YSI data sonde. • Zooplankton caught in the net were preserved with 50 mL of 37% formalin in a cod-end jar (500 mL sample volume). • The zooplankton samples were identified by the University of South Florida laboratory, down to species where possible. Decapod larvae were classified as zoea, megalopa, or mysis stage. • Freshwater inflow was determined by USGS water-stage stations for several of the tributaries and converted to daily averages (cfs). Salinity was also used as a proxy for freshwater inflow. • Contour plots of species density and water quality data were produced using SURFER 8 (a contouring and 3D surface mapping program) • Multivariate analysis was performed using PRIMER (Plymouth Routines In Multivariate Ecological Research) software to investigate the larval decapod community structure. Fig. 10: MDS plot using decapod densities - Wet season samples (June 2005). Station numbers (1-16) are superimposed on salinity bubbles. Fig. 8: Decapod densities - Wet season samples (June 2005). Sample numbers (1–16) represent stations. Clusters shown in red are non-significant. tributaries. June 2005 (Wet) • Wet (rainy) season = May – October • Dry season = November - April Fig. 11: MDS plot using decapod densities- Dry season samples (June 2006). Station numbers (1-16) are superimposed on salinity bubbles. Fig. 9: Decapod densities - Dry season samples (June 2006). Sample numbers (1–16) represent stations. Clusters shown in red are non-significant. June 2006 (Dry) • REFERENCES • Anger, K. 2001. The biology of decapod crustacean larvae. A.A. Balkema Publishers, Lisse, Holland. • Browder, J.A. 1991. Watershed management and the importance of freshwater flow to estuaries, p. 7-22. In S.F. Treat and P.A. Clark (eds.). Proceedings, Tampa Bay Area Scientific Information Symposium 2, 1991 February 27-March 1, Tampa, Florida. • Capaldo, P.S. 1993. Salinity preferences in the stage-I-zoeae of the red-jointed fiddler crabs, genus Uca. Estuaries 16: 784-788. • Charlotte Harbor National Estuary Program (CHNEP), for South Florida Water Management District. 2005. Lower Charlotte Harbor Reconnaissance Report. Fort Myers, FL. • Day, J.W., Jr., Hall, C.A.S., Kemp, W.M., and Yanez-Arancibia, A. 1989. Estuarine Ecology. John Wiley and Sons, New York. • Schmitten, R.A. 1999. Essential fish habitat: Opportunities and challenges for the next millennium, p. 3-10. In L.R. Benaka (ed.). Fish Habitat: Essential Fish Habitat and Rehabilitation. American Fisheries Society Symposium 22. American Fisheries Society, Bethesda, Maryland. ACKNOWLEDGEMENTS: Peter Doering, Bob Chamberlain, Kathy Haunert, and Tomma Barnes (SFWMD); Ernst Peebles, Ralf Kitzmiller (USF); Erin Dykes, Lesli Haynes, Amanda Booth (FGCU Coastal Watershed Institute); FGCU Marine Lab Interns; Mike Byrne (USGS) Figure 6: Eurypanopeus depressus density (no. m-3) Figure 7: Rhithropanopeus harrisii density (no. m-3) Table 1: Density-weighted salinity of capture (SU), or the central tendency for organism density Salinity (psu)