Download

1 / 1
10 likes | 203 Views
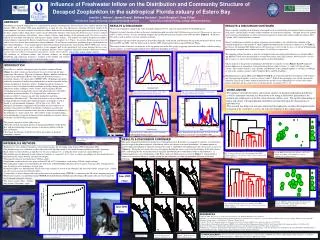
Salinity June 2005. Salinity June 2006. The Effect of Freshwater Inflow on the Spatial and Temporal Distribution of Ichthyoplankton and Gelatinous Zooplankton in Estero Bay, Florida. James Evans 1 , Jennifer Nelson 1 , Bethany Bachelor 1 , Scott Burghart 2 , Greg Tolley 1. Introduction.

E N D
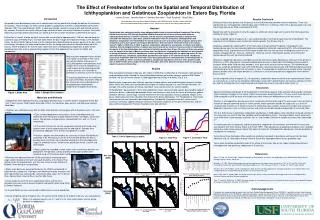
Salinity June 2005 Salinity June 2006 The Effect of Freshwater Inflow on the Spatial and Temporal Distribution of Ichthyoplankton and Gelatinous Zooplankton in Estero Bay, Florida James Evans1, Jennifer Nelson1, Bethany Bachelor1, Scott Burghart2, Greg Tolley1 Introduction Results Continued 1Florida Gulf Coast University, Coastal Watershed Institute, 10501 FGCU Blvd South, Fort Myers, Florida 33965-6565 Diversity of fishes was greater near the passes to the Gulf of Mexico and lower near the tributaries. There was significantly less ichthyoplankton collected bay wide in 2006 than in 2005 (p<.0001) with a general pattern of a one month lag in density for 2006 as compared to 2005. Egg density and the presence of early life stages (i.e. preflexion larval stage) were used to infer likely spawning habitats for fishes (Table 2). Density-weighted salinity of capture (Su ) was used to provide an estimate of species center of distribution. The majority of fish distributions were centered at salinities greater than 30 psu (Fig. 9). Gelatinous zooplankton comprised 9% of the total catch and represented 18 species. Chaetagnaths and hydromedusae were the most abundant gelatinous zooplankton collected, representing 99% of the total gelatinous zooplankton catch. Sagitta tenuis and Ferrosagitta hispida were the most common chaetagnaths present in the samples. Bougainvillia sp., Clytia sp., Eutima sp., Obelia sp. and an unidentifiable species were among the hydromedusae that were commonly collected. Gelatinous zooplankton densities varied both seasonally and interannually. Abundances were four times greater in 2006 than in 2005. Mnemiopsis maccradii exhibited peak densities in November 2005 following the passage of hurricane Wilma while 2006 densities peaked in June, prior to the onset of the wet season. The hydromedusae Clytia sp. varied greatly between years with 2005 densities remaining relatively low and 2006 abundances peaking dramatically prior to the onset of the wet season in June. The chaetagnath Sagitta tenuis showed similar seasonal patterns for both years with higher densities in 2006 than in 2005 with peak densities lagging one month behind those in 2005. Density weighted salinity of capture (Su ) for gelatinous zooplankton demonstrated that the hydromedusae Eutima sp. and Clytia sp. as well as the ctenophore Mnemiopsis maccradyi had distributions centered at salinities of 25-30 psu and the chaetagnaths Ferrosagitta hispida and Sagitta tenuis were centered at 33 psu (Fig. 10). Increased human development pressure in coastal areas has the potential to change the delivery of freshwater to estuaries. These changes can affect salinity gradients, productivity, and their associated biotic communities (Browder 1991; Tsou and Matheson 2002). In southwest Florida, rainfall is seasonal with well defined wet and dry seasons. Seasonal rain events often put large volumes of water into coastal tributaries in pulses. Increased impervious coverage within watersheds can speed up the rate at which freshwater is delivered to the coast. Estero Bay is a small, shallow, bar-built estuary with a watershed of approximately 1,196 km2 located along the southwest coast of Florida (Fig.1). Surface water enters the bay through five tributaries Hendry Creek, Mullock Creek, the Estero River, Spring Creek, and the Imperial River located along the eastern portion of the Bay. Land use changes throughout the watershed threaten to alter the timing and amount of freshwater delivered to the estuary. These changes to the natural water regime can have unanticipated consequences to downstream aquatic communities such as economically important finfish that depend on the estuary for habitat and reproduction. 2University of South Florida, College of Marine Science, 140 7th Avenue South, St. Petersburg, Florida 33701-5016 Abstract Zooplankton were collected monthly using oblique plankton tows at sixteen stations throughout Estero Bay, Florida from January 2005 through December 2006 to determine the influence of freshwater inflow on ichthyoplankton density, recruitment potential, and the presence of gelatinous predators. Samples were collected from tidal passes, open bays, and three tributaries within the study area. Ichthyoplankton and gelatinous zooplankton were identified to the lowest practical taxon and contour plots of species density were analyzed to assess their spatial and temporal distributions. Total cumulative freshwater inflow to the estuary was 42% higher in 2005 than in 2006. In general, zooplankton abundances were greater at stations with higher salinities. Density-weighted salinity of capture was used to provide an estimate of species center of distribution. A majority of the fish distributions were centered at salinities greater than 30 psu. Diversity of fishes was greater near the passes to the Gulf of Mexico and lower near the tributaries. Ichthyoplankton abundances were greatest in spring and summer with peak abundances occurring in March, coinciding with the spawning season for the most abundant taxa. Gelatinous zooplankton abundances were higher in the summer with peak abundances occurring in September 2005 and June 2006. There was significantly less ichthyoplankton collected baywide in 2006 than in 2005 (p<.0001); in contrast, gelatinous zooplankton abundances were four times greater in 2006 than in 2005. Results of this study will help water managers determine optimal freshwater flows for managing aquatic resources in Estero Bay. Most estuarine dependent fishes exhibit very regular seasonality in their use of low salinity habitats (Flannery et al 2002).Management considerations must include these seasonal components to avoid impacts during spawning periods or when juveniles are vulnerable to predation or advection out of the estuary. The primary objectives of this study were to assess the effects freshwater inflow on the relative density and distribution of ichthyoplankton and gelatinous zooplankton throughout Estero bay. Results Total cumulative freshwater inflow was 42% higher in 2005 than in 2006 (Fig. 4). Freshwater inflow during the study period generally reflected the annual fluctuation between wet and dry seasons typical of SW Florida; however, the start of the wet season in 2006 lagged behind 2005 by 4–6 weeks (Fig. 3 & 4). Monthly water temperature was relatively consistent among stations and exhibited typical seasonal variation. Mean salinity was lower and standard deviation higher at stations located in or near the tidal tributaries. On average, the southern portion of the bay had higher mean salinities than the northern portion. Discussion Ichthyoplankton represented 4% of the total zooplankton catch, representing 48 species dominated by eggs of anchovies, drums, unidentified percomorph fishes, and herrings as well as by the larvae of anchovies, gobies, skilletfish, blennies, and herrings. Anchoa mitchilli were the most abundant anchovy collected. Gobies of the genus Gobiosoma were more abundant than those of the genus Microgobius. The Florida blenny Chasmodes saburrae was the most abundant, identifiable blenny. Gulf pipefish Syngnathus scovelli; sand seatrout Cynoscion arenarius; spotted seatrouts Cynoscion nebulosus; kingfishes of the genus Menticirrhus; and the soles Achirus lineatus and Trinectes maculates were also common. Spatial and temporal distribution of ichthyoplankton in Estero Bay appears to be primarily influenced by freshwater inflow resulting in changes to the salinity regime and seasonal spawning patterns. The one-month lag in density in 2006 compared to 2005 for many of the organisms likely reflects the delayed onset of the wet season. Declines in ichthyoplankton density occurring in association with the beginning of the wet season may have been a function of reduced spawning activity in some species, and/or advection outside the study area as a result of increased flow. Flannery et al (2002) found that in Tampa Bay, total numbers of estuarine-resident and estuarine-dependent organisms such as the bay anchovy and sand seatrout decreased during periods of increased inflow. The four-fold increase in gelatinous zooplankton abundances in 2006 appears to be related to increased salinities in the study area as a result of low flow conditions and isolated bloom events. The largest bloom events occurred in June 2006 where Clytia densities reached 1,201 m-3 and October 2006 where Sagitta tenuis densities reached 86 m-3. It is well known that Chaetagnaths and other gelatinous zooplankton are carnivores that feed on fish larvae and also compete with them for prey (Baier and Purcell 1997). High abundances of gelatinous predators were recorded during this study raising concerns about their potential impact on ichthyoplankton abundances through predation or competition for resources. During times of low freshwater inflow, gelatinous predators increased in abundance and moved into the bay’s tributaries (Fig. 8). Reduced freshwater inflow to Estero Bay could potentially increase predation rates. Future work should be conducted to look at the effects of freshwater flow on the trophic relationships between ichthyoplankton and gelatinous zooplankton in Estero Bay. Figure 1. Study Area Table 1. Sample Site Locations Materials and Methods • Zooplankton were collected monthly using oblique plankton tows at sixteen stations throughout Estero Bay (Fig. 1) from January 2005 through December 2006 in the tributaries, open waters, and tidal passes during flood tides. • Plankton was collected using a 500-μm Nitex mesh plankton net equipped with a flowmeter and a 1-liter cod end jar. • Each sampling deployment consisted of a three-step oblique tow that divided the net’s fishing time equally between bottom, mid-depth, and surface waters. Tow duration and speed were standardized 5 min and 1.0-1.5 m/s, respectively. • At the end of the tow, the net was suspended vertically and rinsed using ambient water to wash zooplankton into the cod-end jar. Samples were preserved by adding 50 ml of formalin and placed in a cooler. • Plankton samples were delivered to the University of South Florida Marine Laboratory in St. Petersburg, FL where they were identified to the lowest practical taxon and fishes were classified according to their developmental stage (i.e. prefelxion larvae, flexion larvae, postflexion larvae, juvenile, and adult stages). • Water quality was recorded at each station at the end of each plankton net deployment. Temperature, salinity, and dissolved oxygen profiles were recorded using a YSI multi-parameter sonde. 1 month lag 42% Table 2. Likely Spawning Locations Figure 3. Total Flow Figure 4. Cumulative Flow References Wet June (2005) • Flow data was obtained from the USGS continuously monitoring water-stage stations located at the north and south branches of the Estero River, Spring Creek, the Imperial River, and Ten-mile Canal (a major tributary of Mullock Creek) during the study period. • Water stage data were converted to flow by the USGS and reported as cubic feet per second (cfs). Flow data were converted to daily averages and total indexed flow was estimated by summing the daily values for the Estero River, Spring Creek, Imperial River, and Ten Mile Canal. • Contour plots for all of the water quality parameters and the most abundant taxa were used to assess temporal and spatial trends using Surfer 8 (Golden Software). • A Kruskal-Wallis test was used to look at differences in annual abundance. Baier, C.T. and J.E. Purcell. 1997. Trophic interactions of chaetagnaths, larval fish, and zooplankton in the South Atlantic Bight. Marine Ecology Progress Series 146:43-53 Browder, J.A. 1991. Watershed management and the importance of freshwater flow to estuaries, p.7-22. In S.F. and P.A. Clark (eds.). Proceedings, Tampa Bay area Scientific Information Symposium 2, 1991 February 27-March 1, Tampa, FL. TEXT, Tampa, Florida Flannery, M.S., E.B. Peebles, and R.T. Montgomery. 2002. A percent-of-flow approach for managing reductions of freshwater inflows from unimpounded rivers to Southwest Florida estuaries. Estuaries 25:1318-1332 North, E.W. and E.D. Houde. 2004. Distribution and transport of bay anchovy (Anchoa mitchilli) eggs and larvae in Chesapeake Bay. Estuarine Coastal and Shelf Science 60:409-429 Tsou, T.T and R.E. Matheson, Jr. 2002. Seasonal changes in the nekton community of the Suwannee River estuary and the potential impacts of freshwater withdrawal. Estuaries 25:1372-1381 Figure 5 A. mitchilli Egg Density June 2005 Figure 6. Eutima sp. Density June 2005 Figure 9. Ichthyoplankton Density-Weighted Mean Salinity of Capture Acknowledgements Dry June (2006) This project was made possible by a grant from the South Florida Water Management District (SFWMD). I would like to thank Peter Doering and Bob Chamberlain of the SFWMD for supporting the project. I would also like to thank Ernst Peebles and Ralph Kitzmiller at the University of South Florida for processing and identifying the zooplankton samples; Erin Dykes and Lesli Haynes at the FGCU Marine Lab for their logistical support during field sampling; and Mike Burns at the United States Geological Survey for providing flow data. • Density-weighted salinity of capture (SU) -the central salinity tendency for organism density- was calculated as: Σ (S·U) Σ U Where U is organism density (no. m-3) and S is the mean water-column salinity during plankton net deployment. SU = Figure 8. Eutima sp. Density June 2006 Figure 10. Gelatinous Zooplankton Density-Weighted Mean Salinity of Capture Figure 7. A. mitchilli Egg Density June 2006