Download
1 / 27
280 likes | 353 Views
Plan. Indicators GIS data Hydrological data Land Use Map Land Use Change. INDICATORS and SCENARIOS. Water demand. DRIVING FORCES. Population. Water policies. Industry. Tourism. ( Quantity and not quality ). LUC. Agriculture. Urbanization. Water quality. PRESSURE. Water resources.

E N D
Plan • Indicators • GIS data • Hydrological data • Land Use Map • Land Use Change
Water demand DRIVING FORCES Population Water policies Industry Tourism ( Quantity and not quality ) LUC Agriculture Urbanization Water quality
PRESSURE Water resources Tourism Urbanization Water demand Industry Tourism Water pollution Water quality
STATE Water resources Tourism Domestic Heavy Water demand Overexploitation: GW Agriculture • Fresh water affected • Salt water intrusion Degradation of water quality
IMPACTS ECONOMY ENVIRONMENT SOCIETY
Immigration / emigration Urban population Natural growth rate Rural population Water consumption National policiesfor tourism development Land use change Reduce in precipitation rate Industry + Tourism Population Subvention Taxes Mobilization for surface water Irrigated surface Pollution Salinity Surface water Losses (Network ) Import Ground water Irrigation techniques Prohibited perimeters Policies Water Ressources Agriculture Water Quality Decline in ressources quantity Lack of control Increase in Water demand Increase in Water demand Increasing demand for water Lack of suitable water Insufficient water supply
The major problems related to water resources in Hammamet (involve) imbalance between supply and demand • Water demand is superior than water supply involve exploitation of ground water (Intrusion of salted water) • Over exploitation of surface water
Deficit in Precipitation (last 10 years) • Over exploitation caused by tourism and domestic • Taxation insufficient • Squandering (Social) Lack of water resources Loss of water quality and quantity
Water Quality Water pollution Municipality’s Sewage water Industrial effluents Agriculture activities Solid wast • Low rate of connection • Important pollutant charge • Drainage and washing practice • Lixiviates • Overexploitation of ground water • Throwing out on natural • environment • overloading of Swage stations • Mud generate from Sw S°
DEM 20 Meters • SPOT images 10 Meters • Maps 1/25.000 • Hydrographic network • Elevation Point • Chart level • AOI • Road network • Etc.
Hydrographic network • Subcatchment • Bathymetry ( probe point) • flow direction • Hydrographic area • Wells • Etc.
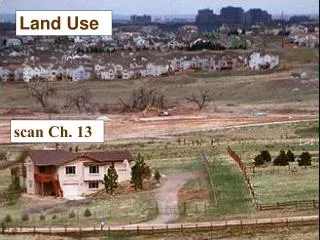
Land Use • Source: Arial Photo – 1/20000 • Classification: Photo-interpretation • Source: Spatial images - SPOT 2000 – 10 m • Supervised classification