Download
1 / 15
150 likes | 270 Views
The Draw of the Coast. Professor Andrew Beer Centre for Housing, Urban and Regional Planning University of Adelaide. Introduction. Are we drawn to the coast? What are the demand factors? What are the supply factors? Where to next?. The Draw of the Coast.

E N D
The Draw of the Coast Professor Andrew BeerCentre for Housing, Urban and Regional PlanningUniversity of Adelaide
Introduction • Are we drawn to the coast? • What are the demand factors? • What are the supply factors? • Where to next?
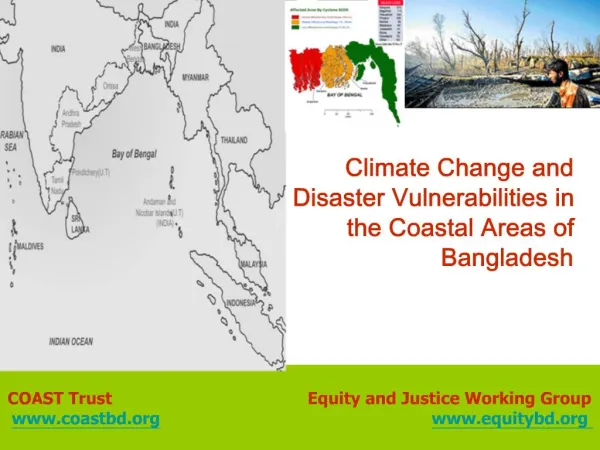
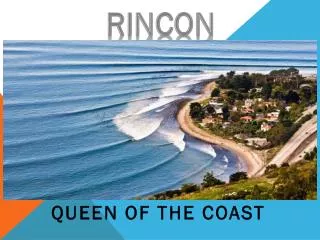
The Draw of the Coast • The National Seachange Taskforce estimates that • 86% of Australians live under 50km from the coast • Growth in coastal areas consistently higher than the national average • Especially WA, Queensland and NSW • Australia’s population in 2010 - 22 m • Capital cities 14 m • Non-metro Australia 8 m • Non-metro – coast 6.9 m
Demand Factors Behind the Draw of the Coast • Demographic processes • Increased life expectancy • Increased period post retirement • Mobile population with limited commitment to one place or community • Increased willingness to migrate in older age • Lesser reliance on family in old age • The Baby Boom Generation • Generation X
Demand Factors Behind the Draw of the Coast • Increased wealth in older age • A generation and generations of home owners • House prices outstripping inflation since 1970 • Concentration of immigrant arrivals in the major capitals • A more productive labour force with greater savings in older age • In some instances, access to redundancy payments
Demand Factors Behind the Draw of the Coast • The working aged • Salt notes that while coastal growth started with older generations, now taken up by those of economically active age • Impact of restructure of the economy from goods to services • Partly servicing growth initiated by older population • Fly In/Fly Out, Drive In/Drive Out • Refugees from high capital city house prices • Perceived life style advantages
Demand Factors Behind the Draw of the Coast • Impact of second home ownership • Evidence that second home ownership predisposes households to a longer term move • 30% of 55-64 year olds own a second property
Supply Factors Behind the Draw of the Coast • Improvements in infrastructure provision • Especially transport • Road infrastructure (eg Pacific Highway; Southern Expressway) • Rail infrastructure (eg rail from Brisbane to Robina) • Air services – Coffs Harbour, Port Macquarie, Hervey Bay • Telecommunications enhancements • Some rise in telecommuting • The Barefoot Executives • Potential impact of the NBN
Supply Factors Behind the Draw of the Coast • Land, housing and construction costs • More affordable than capital cities • More permissive planning regimes in some jurisdictions, especially on the east coast • Creation of a viable housing market reduces some of the risk of movement • Lifestyle migration • On-going impact of the ‘population turnaround’ of the 1970s
Where to Next? • A trend unlikely to end in the foreseeable future • Baby Boom, Gen X, Gen Y • Older persons cycling through coastal locations • May change with the Productivity Commission’s reforms • Increased pressure for social infrastructure • Which in turn will fuel growth • Increased attractiveness with climate change
Where to Next? • Restricted land supply for further housing and development in some locations • Eg Coffs Harbour, Ballina • Spillover from coastal to near coastal locations • Eg Lismore • A positive thing • Greater choice within the Australian urban system • More affordable housing