Download
1 / 17
170 likes | 282 Views
This guide explores the importance of graphs in representing data, highlighting how they provide clearer insights than raw data. Key concepts include the independent and dependent variables represented on the x-axis and y-axis, respectively. The document explains types of relationships — direct, indirect, cyclic, and no relationship — illustrated with real-world examples. Additionally, it discusses the concepts of rate of change and gradient, with definitions, equations, and practical examples illustrating their applications in measuring changes over time and distance.

E N D
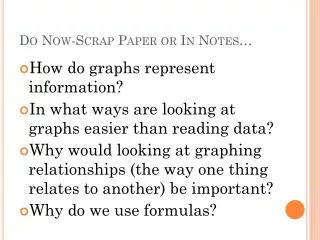
Do Now-Scrap Paper or In Notes… • How do graphs represent information? • In what ways are looking at graphs easier than reading data? • Why would looking at graphing relationships (the way one thing relates to another) be important? • Why do we use formulas?
Graphing • Graph: a diagram that shows a relationship between two sets of numbers • The x-axis runs horizontally (left-right) through zero
Independent variable (x-axis): a variable that determines the value of another variable-Variable that is being changed • ex. temp, time, amount of moisture
The y-axis runs vertically (up and down) through zero • Dependent variable (y-axis): A variable whose value is determined by the independent variable (examples: growth of mold, change in temp)
Graphing Relationships 1. Direct: As one variable increases, the other also increases • Example: Population vs. Pollution
2. Indirect: As one variable increases, the other decreases A. Example: Recycling vs. Amt of Garbage
3. Cyclic: As one variable increases, the other change in a predictable pattern A. Example: Moon Phases
4. No Relationship: As one variable increases, the other does not change • Example: Color of Shoes vs. Test Score
Rate of Change- ESRT PAGE 1! • Definition: The speed at which a variable changes over a specific period of time • Equation: Change in Field Value/Time • Field Value: factor being measured, in this case, typically distance or temperature • Change in Field Value= Ending Value- Starting Value
Units: meter/second, miles/hour, 0F/minute, etc • The bigger the answer the faster the variable is changing • Example: 30 mph vs. 55 mph
Example • You are climbing a hill. You start at 25 feet and end at 75 feet. It takes you 15 minutes to climb the hill. What is your rate of change? • Field Value 2: • Field Value 1: • Change in Time: • PLUG AND CHUG!
Gradient • Gradient measures the slope of an object, such as a hill • Equation: Change in field value/distance • Change in field value= Ending elevation-Starting elevation • The denominator is the horizontal distance
Units: meter/kilometer, feet/mile, etc • The bigger the number, the faster the elevation changes, the steeper the gradient (aka slope) • Example: Himalayas have a steeper gradient then the Catskills
Example • The bottom of Mt. Beacon has an elevation of 25 feet. The top of Mt. Beacon has an elevation of 1250 feet. The distance from the bottom of the mountain to the top is 3 miles. What is the gradient of Mt. Beacon? • Field Value 2: • Field Value 1: • Change in Distance: • PLUG AND CHUG!