Phys 1830: Lecture 27
350 likes | 363 Views
Phys 1830: Lecture 27. NASA’s Solar Dynamics Observatory: Extreme UltraViolet wavelengths. Image Workshop! Dec 3 at 7-10pm Allen Building. Previous Classes: The Sun This Class The Sun Greenhouse Effect Stars Luminosity Upcoming Classes Stars Radii, Mass Lifetime

Phys 1830: Lecture 27
E N D
Presentation Transcript
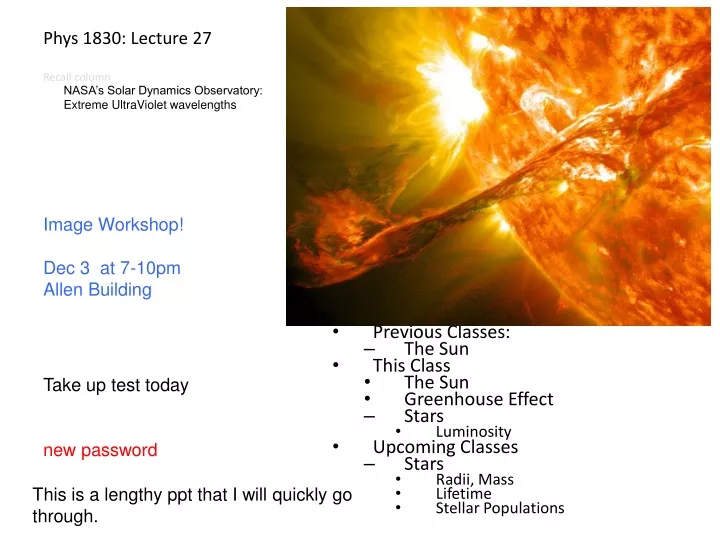
Phys 1830: Lecture 27 NASA’s Solar Dynamics Observatory: Extreme UltraViolet wavelengths Image Workshop! Dec 3 at 7-10pm Allen Building • Previous Classes: • The Sun • This Class • The Sun • Greenhouse Effect • Stars • Luminosity • Upcoming Classes • Stars • Radii, Mass • Lifetime • Stellar Populations Take up test today new password This is a lengthy ppt that I will quickly go through.
New IPCC report – trends continue • Check the King’s Centre for Visualization in Science for interactives on climate change: http://www.kcvs.ca/site/projects/climate.html • Melting ice caps could disrupt ocean currents. If the Gulf Stream is responsible for heating Europe and it is disrupted, then Europe could experience an “ice age”. • Currently needs more research and monitoring of ocean currents.
Stars: Their Characteristics • Luminosity: energy output • Temperature • Size
Stars: Their Characteristics Recall Inverse Square Brightness Law Luminosity, or absolute brightness, is a measure of the total power radiated by a star. Apparent brightnessis how bright a star appears when viewed from Earth; it depends on theabsolute brightnessbut also on the distanceof the star.
Luminosity and Apparent Brightness Therefore, two stars that appear equally bright might be a closer, dimmer star and a farther, brighter one:
More Precisely 17-1: More on the Magnitude Scale Apparent brightness when measured using a logarithmic, magnitude scale, which is related to our perception is called apparent magnitude. Absolute magnitude is the apparent magnitude that a star would have if it were placed 10 parsecs from Earth. A reduction of 5 in magnitude corresponds to an increase in a factor of 100 in luminosity. Magnitudes are inverted in scale, such that bright stars have low magnitudes. Converting from magnitude to luminosity in solar units: This graph allows us to perform this conversion simply by reading horizontally.
Question 5 In the stellar magnitude system, a smaller magnitude indicates a _____ star. 1) brighter 2) hotter 3) cooler 4) fainter 5) more distant
Question 5 In the stellar magnitude system, a smaller magnitude indicates a _____ star. 1) brighter 2) hotter 3) cooler 4) fainter 5) more distant
Question 7 1) one million km. 2) one astronomical unit. 3) one light year. 4) ten parsecs. 5) ten light years. The absolute magnitude of a star is its brightness as seen from a distance of
Question 7 1) one million km. 2) one astronomical unit. 3) one light year. 4) ten parsecs. 5) ten light years. The absolute magnitude of a star is its brightness as seen from a distance of Astronomers use a distance of 10 parsecs (about 32 light years) as a standard for specifying and comparing the brightnesses of stars.
Stars: Their Characteristics • Let’s now look at the properties of a star if you were at its surface. • Then “distance” is the radius of the star.
Stars: Their Characteristics • The flux (F) of energy radiated through a centimetre square patch on the surface per second.
20,000° K 10,000° K 5000° K Intensity 2000° K 1000° K 500° K Wavelength (nm) X-Ray Ultraviolet Visible Infrared Microwave Radio Star: Their characteristics Blackbody curves • Recall that stars radiate very similarly to ideal blackbodies. • Their flux (F) is related to their temperature (T). ( is a constant.)
Stars: Their Characteristics • Luminosity (L): The total energy radiated per second, at all wavelengths. • L = surface area * flux • Surface area of a sphere is Luminosity is proportional to the radius squared times surface temperature to the 4th power.
Stars: Why Temperature is useful. • Notice that if we know the temperature of a star, then if we know the radius, we can calculate the luminosity. • Alternatively, if we know the temperature and the luminosity we can determine the radius.
20,000° K 10,000° K 5000° K Intensity 2000° K 1000° K 500° K Wavelength (nm) X-Ray Ultraviolet Visible Infrared Microwave Radio Stars: Surface Temperatures Black body curves • Judiciously select filters and image the star in each of the filters using a CCD. • Measuring the magnitude of the star is called photometry. • Example of stars in HST data in .xcf file.
10,000° K 5000° K Intensity Wavelength (nm) Stars: Surface Temperatures Black body curves “Colour” is a proxy for temperature • The cool, red star will have a higher intensity (lower magnitude) in the red filter compared to its blue filter. • The hotter, blue star will have a higher intensity (lower magnitude) in its blue filter compared to its red filter. • We can then reconstruct the black body curve. • The black body curve temperature.
How do we determine the temperature? • One way is to do photometry on images of stars in different filters. • This gives points on the black body curve. • “Connecting the dots” of intensity can trace the black body curve. • the peak of the black body curve tells us the temperature of the star. • this procedure does not take much observing time.
hotter star cooler star
Review: • You are measuring the apparent magnitude of a star by doing photometry. You find that more light comes through the red filter than through the visual filter. Also more light comes through the visual filter than through the blue filter. (Hint draw the black body curve.) This means that the star • has a reddish colour and is cool. • has a greenish colour and is about the same temperature as our sun. • has a bluish colour and is very hot.
Stellar Temperatures Stellar spectraare much more informative than the blackbody curves. However they take more observing time. There are seven general categories of stellar spectra, corresponding to different temperatures. From highest to lowest temperature, those categories are: O B A F G K M This classification is called Spectral Type or Spectral Class.
Stellar Temperatures Here are simplified diagrams of their spectra: If we can classify a star by this system, then we know its temperature.
Stars: Plot Luminosity versus Spectral Class Plots: • Plot astronomer’s height versus astronomer’s weight. • Plot astronomer’s height versus astronomer’s IQ. • Plot Luminosity versus Temperature (Spectral Type) • As if there were no relationship. • As if there is a 1-to-1 correlation.
Stars: Hertzsprung-Russell Diagram • This is the sort of diagram we get when we plot data. • 20,000 stars. • Note that the sun is a G star.
The Hertzsprung-Russell Diagram These are the 80 closest stars to us; note the dashed lines of constant radius. The darkened curve is called the main sequence (MS), as this is where most stars are. 90% of all stars are on the MS. Also indicated is the white dwarf (WD) region; these stars are hot but not very luminous, as they are quite small. 1% of all stars are WD.
The Hertzsprung-Russell Diagram These 100 stars are all more luminous than the Sun. Two new categories appear here—the red giants and the blue giants.
Stars: Hertzsprung-Russell Diagram Be able to draw the HR diagram later in this class! (Including the ranges on the axes.) • General regions: • Main Sequence (MS) • White Dwarfs (WD) • Giants • Supergiants
Stars: Hertzsprung-Russell Diagram The highest density of stars is in the Main Sequence (MS). • Roughly 41000 stars from the ESA Hipparcos mission. • HIPPARCOS measured • precise positions, parallaxes and motions • 2.5 million stars in 3.5 years • Out to about 200 pc • 2 colour photometry for 400,000 stars
Stars: Hertzsprung-Russell Diagram • If we know only the temperature, can we use the H-R diagram to know the luminosity of a star? • Yes. • No.
Stars: Hertzsprung-Russell Diagram • Notice that there isn’t a 1-to-1 correlation between temperature and luminosity.
Stars: Hertzsprung-Russell Diagram • If we know only the temperature, can we use the H-R diagram to know a unique luminosity for a star? • Yes. • No.
Stars: Hertzsprung-Russell Diagram • Given the temperature we need to know the radius to get the luminosity. • Similarly if we know the luminosity we need the radius to get the temperature. • How do we get the radius of a star?
Stars: Hertzsprung-Russell Diagram This is an important diagnostic tool that allows us to find radii, distances, and other characteristics of stars. We can even trace a star’s evolution from birth to death on the diagram. • Draw the HR Diagram and include and label the following: • 4 axes and their ranges • General regions where stars reside • The location of the sun
Stars: Hertzsprung-Russell Diagram • General regions: • Main Sequence (MS) • White Dwarfs (WD) • Giants • Supergiants
Stars: Hertzsprung-Russell Diagram • Given the temperature we need to know the radius to get the luminosity. • Similarly if we know the luminosity we need the radius to get the temperature. • How do we get the radius of a star?