Download
1 / 22
220 likes | 237 Views
Explore key market trends like rising US leveraged loans, repatriation of US money, silver/gold ratio dynamics, Kondratiev's Economic Cycle, and more in this comprehensive compilation by Ritesh Jain. Gain valuable insights for informed decision-making.

E N D
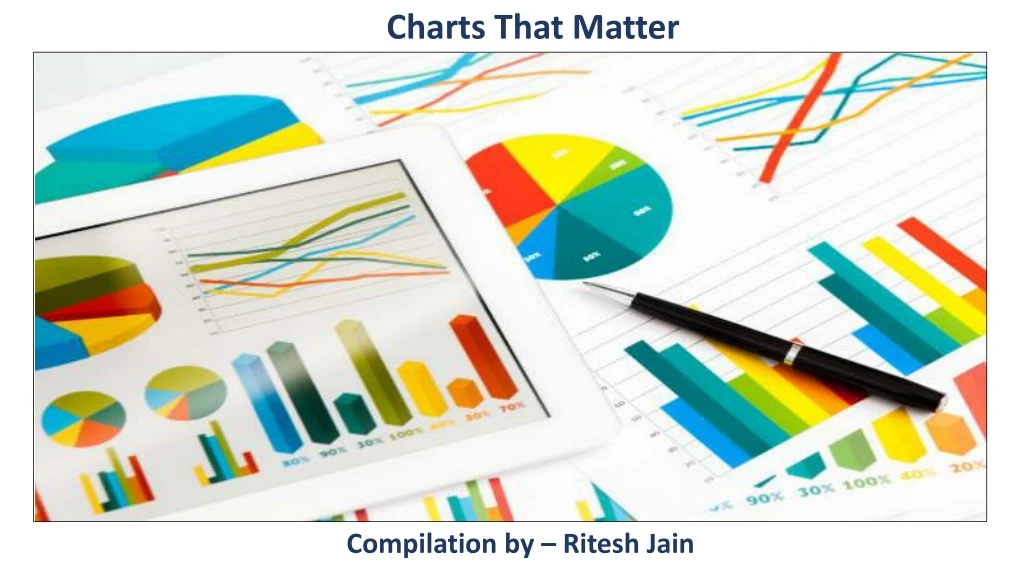
Charts That Matter Charts That Matter Compilation by: Ritesh Jain Compilation by – Ritesh Jain
Rising US Leveraged loans Leveraged loans are extended to companies/individuals that already have considerable amounts of debt and/or a poor credit history. These carry a higher risk of default.The U.S. leveraged loan market has grown steadily since the financial crisis, fuelled by investment into the floating rate asset class. The U.S. leveraged loan market grew to $1.06 trillion in July, another record for the asset classMore than 80 percent of new loans are "covenant lite" loans, with no financial maintenance restrictions, that give borrowers flexibility to issue more debt, pay out shareholder dividends and even put collateral out of lenders' reach.
US – Repatriation of monies Why only US markets are rising whereas others including Europe and Asia are much below their peak The reason is stock buybacks and reduction in US corporate tax rates. The second reason has led to USD 300 billion dollars flowing back to US this year (the average of last 8 years is 50 billion). The whole purpose of tax cuts was to bring US corporate money lying abroad, back to US and hoping that it would be spent in capex and increase in employment generating industries. Instead most of this money brought back is used for stock Buybacks. The buybacks are reducing the supply of available stock in the equity market keeping US equity markets at an elevated level. This phenomenon is also leading to shortage of dollar in rest of the world, especially emerging markets which were not prepared for massive capital outflows. FED raising the rates is compounding the problems as higher US rates (which makes their bonds attractive) will only attract more capital to US from rest of the world. FED would need to continue raising the rates because US economy is showing strength.
Narrowing Silver/Gold Ratio Theoretically, Silver is regarded as ‘Inflation indicator’ and Gold as ‘Crises Metal’. Masses prefer to hold Silver to hedge against rising inflation and Gold when they see volatile times ahead. Decreasing ratio would denote either –Gold is preferred over Silver and economy pursue Crises as a bigger worry than Inflation or – Other Asset classes are giving better risk adjusted returns; hence metals becomes less favorable to hold. In the past decade emerging markets have continuously underperformed Developed markets and this phenomena has coincided with lowering Silver /Gold ratio. If interest rates remain low, as they've been for the better part of eight years, investors who choose to buy interest-bearing assets (such as bonds or CDs) may lose real money to the inflation rate. On the flipside, if interest rates rise, then investors may swap out of precious metals and into interest-bearing assets since they can net a higher guaranteed return, pushing the prices of gold and silver lower.
Nikolai Kondratiev’s Economic Cycle Phase (K-Waves) In the 1920s, Russian economist Nikolai Kondratiev developed a theory that prices, interest rates, foreign trade etc in capitalist countries moved in long waves of 50-60 years. Technology did not evolve linearly, but rather in leaps every 50 to 60 years. India could be in the last leg of Autumn – High consumer debts, low CPI/WPI (because of low food inflation despite huge rise in Crude prices), Equity market volatility, rising wealth disparity U.S. may be approaching winters given that – Debt levels are soaring; trade conflicts with Iran/China, trump ‘America first’ philosophy (which is reverse to what a reserve currency country should ideally act as)
Country wise Vulnerability Index India ranks at number 4 in terms of vulnerability index after Malaysia, South Africa and Turkey. This is despite having one of the strongest Macros in the past few years. While Oil has played its part in increasing the Fiscal turmoil, other added factors such as Iran Sanctions, trade wars etc added to this. Strengthening $ vs. all other major emerging market currencies also played a huge part in adding to the vulnerability. It will be interesting to see the fiscal prudence that the current government will adhere to given that election year coincides with other worsening global & domestic macros.
Post Lehman, Foreigners Have Made More Money Out of Indian Stocks Than Indians FIIs and DIIs have usually operated in opposite directions. The years FIIs have bought, DIIs have sold, or not bought as much, and vice versa. Of all the years, 2012-2013 was the year of extremes. The same is true for the current financial year as well. As the stock prices have soared over the last few years, the FIIs have not bought much. A bulk of their buying in Indian stocks happened before and in 2014-2015 when the PE ratio of Sensex was lower than 19, a clear indication of the age-old stock market wisdom of buying low. Bulk of the investment by DIIs in stocks has happened after the stock market has rallied quite a bit. Most of the buying by DIIs has happened at a time when the price to earnings ratio of the BSE Sensex was greater than 22. In fact, DIIs invested Rs 1,14,600 crore in 2017-2018, the highest amount of money they have ever invested in the stock market, during a single year. Once the current stock market bubble deflates, a new generation of Indian investors will come to the conclusion that investing in the stock market is a gamble, which it clearly is not if one invests in an informed way and not just follow the herd.
The Ideal Long-Short Portfolio • If one had to carry out a perfect hedge across geographies for this year, the ideal portfolio would have been; • Long US Equities • Short China, Mexico, Japan, Germany & Canada Equities • This would have generated an absolute return of ~25% from Jan’18 – Jul’18 vs. ~11.5% generated by DJIA index during the same period.
DJIA /Gold Ratio The relationship between DJIA and Gold is widely debated. The standard view is that these two markets are negatively linked. When stocks go up, the yellow metal dives, and vice versa. A higher ratio implies that people value stocks over the potential in gold prices and vice versa. This is indeed often the case, as gold is a safe haven, so when traders go into defensive mode, they may prefer gold to relatively risky stocks. The Dow gold ratio was more elevated during most of the 2000s decade than it is today; in fact, the magnitude differential is very significant (nearly 24:1 throughout the entire decade). That tells us right there that while the markets are experiencing robust sentiment, it’s nowhere near the level of bullishness seen previously.
Yield curve across Developed Markets The chart compares the movement in yield curve over 2 months. Japan has seen huge spike in the 5 year + maturity zone, signaling that period of negative/low interest rates needs to come to an end in order to bump up the inflation numbers. Similarly, China has seen the curve steepening beyond 3 year horizon as it sits on huge pile of Debt and is facing trade/currency war with U.S. To combat the spike China has resorted to continues devaluation of its currency to remain competitive. While U.S has seen the rates tighten across the curve; they expect more volatility in rates in short term as compared to long term. While could signal that they expect Fed to continue on the rate hiking spree until it stabilizes at a certain level.
Credit distribution across Industry The credit to Non Food sectors (services sector and personal sector loans) have been driving the bank credit growth in the recent months. To add to this, credit to industries grew at a 8-month high pace in Aug'18. With the continued growth in services and personal loans, consumption element can continue to be a driving force for economic growth. Credit to the services sector has risen significantly to 26.7% YoY from a below 10% YoY growth in August last year. The housing loans grew by 17% YoY, while vehicle loans grew by 11.1% YoY. Loans for consumer durables on the other hand, declined drastically by 81.3% YoY in Aug'18, which has been the lowest since Dec'02.
The Oil Saga U.S has surpassed Saudi Arabia and almost compete with Russia to be the highest producer of Oil producer globally. While transporting US Shale oil comes with a large transportation cots, it remains to be seen how will U.S capture markets left unserviced now by Iran, Venezuela etc. This combined with having the largest Defense production base given U.S a very large competitive advantage.
Rewards Spending by top card companies Credit card rewards have interestingly become a very lucrative business. However, these free bees come at a steep costs to the banks. An analysis of top 6 credit card issuers (67% of the market) reveals that since 2010, what banks spend to support credit card rewards has more than doubled, from $10.6 billion to $22.6 billion
The Volatility Factor Given a set of 2 portfolios with same average return over a defined period of time – the one with lower volatility/standard deviation is expected to perform better than the other – when monies is invested into tranches in both the portfolios.
Increasing share of Zombie companies A Zombie Company, also known as zombie firm or living dead, is a term used for a firm that is unable to stand on its own feet – it either needs one or a series of bailouts, or is kept afloat by lenient creditors and below-market interest rates. Researchers at both the BIS and the OECD, the club of wealthy nations, have found evidence that low interest rates seem conducive to the existence of zombies. As interest rates have fallen around the world, such zombies have become more prevalent and have also shown more endurance. On average, across the US, Japan, Australia and western Europe, the proportion of firms that are zombies has risen fivefold since 1987, from 2 to 10 per cent.
The Global Tariff Saga The tariff actions ($50 billion on Chinese imports, tariffs placed on imported steel & aluminium etc) have sparked storms of reaction in the U.S. and around the world. Since the turn of the 21st century, U.S. average tariff rates have consistently been at or near their lowest levels in the nation’s history; today, they’re also among the lowest in the world. In 2016, the average U.S. tariff across all products was 1.61%; that was about the same as the average rate of 1.6% for the 28-nation EU, and not much higher than Japan’s 1.35%. Among other major U.S. trading partners, Canada’s average applied tariff rate was 0.85%, China’s was 3.54% and Mexico’s was 4.36%. Post implementation of 2018 tariffs U.S become the country with highest tariffs in the developed countries basket.
The Bell Curve Analysis The Bell curve confidence Index states that rising interest rates will initially lure investors as long as risk (credit) return trade off plays. As trust goes down in an economy a level comes in interest rates; where, even rising interest rates don’t support the currency. We have seen that happening in turkey or Argentina in recent times