Download
1 / 39
400 likes | 765 Views
Spatial versus temporal variation in San Andreas fault and eastern California shear zone slip rates. Rick Bennett Dept of Geosciences University of Arizona with contributions from Josh Spinler, Noah Fay, Sigr ú n Hreinsd ó ttir, and Megan Anderson.

E N D
Spatial versus temporal variation in San Andreas fault and eastern California shear zone slip rates Rick BennettDept of GeosciencesUniversity of Arizonawith contributions from Josh Spinler, Noah Fay, Sigrún Hreinsdóttir, and Megan Anderson
Conclusions (preliminary) • SAF slip rate varies appreciably along strike • Along strike variability reconciles (all?) differences among geological and geodetic estimates • Slip rate variation facilitated by transrotation across the ETR
The Joshua Tree GPS network San Bernardino GPS network (CSUSB and UofA) Joshua Tree GPS network (UofA)
Joshua Tree GPS network West East
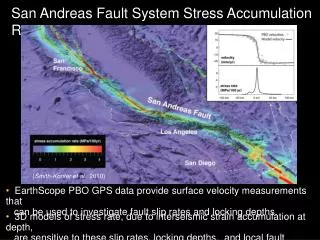
Southern California velocity field UofA SCEC v3
Strain rate field, So Cal – Observed– Predicted
Strain rate field, ETR – Observed– Predicted “belt” of high strain rate
Previous models – Observed– Predicted Johnson et al., 1994 Also see Bennett et al., 1996; Meade and Hager, 2005; Becker et al., 2005
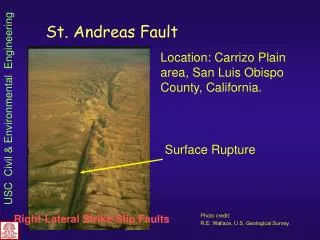
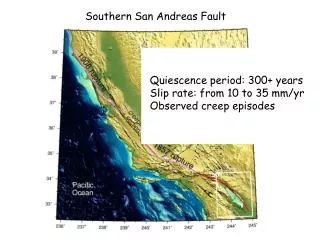
San Andreas fault and eastern California shear zone Large Offset (km’s) Small Offset (meters)
Respect the mapped geology Rationale: If perfectly good faults already exist (e.g., Pinto Mt, Blue Cut, others), why create new ones? Can we reject this hypothesis? That is, is the observed strain rate field really inconsistent with strain accumulation on these mapped faults? What is the role of the Pinto Mountain and Blue Cut faults?
A block model for deformation: rigid block motion SBR fixed CW Translating blocks Rotating JT Block
A block model for deformation: strain accumulation due to locking
Residual velocities
Residual velocities Small JT residuals Large SJFZ residuals
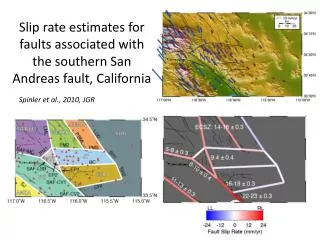
Kinematic results 5 5 JT rotation 14º/Myr clockwise -3 -5 -7 -2 5 5 -1 -9 12 -6 -9 23 2 R-L strike slip (mm/yr) Shortening (mm/yr)
Kinematic results • Block rotation: Paleomag 30-40º sometime in past 10 Myr (Carter et al. 1987). If 14º/Myr => rotating since ~2-3 Ma. • San Andreas fault slip rate ranges between 5 to 23 mm/yr. ~12 mm/yr just north of Biskra Palms. In general agreement with geology. • Pinto Mt and Blue cut left-extensional. Rates as high as 3-6 mm/yr. Total offset 10-20 km (?) consistent with age of 2-3 Ma.
Strain rates reconsidered Observed Modeled
Strain rates reconsidered Observed Modeled at GPS points only
Conclusions Geodesy consistent with the known geology; no “new” faults required Slip rates on ETR faults are important San Andreas slip rate varies appreciably along strike Block rotation rates are fast Dangerous to base geometry of fault models on strain rate inference alone Respect the mapped geology
Future work Continue GPS measurements!! Improve model fault geometry!! Model elastic strain associated with dip-slip motion!! Thoroughly test alternative models!!
Conceptual issue What is “present-day” slip rate? Zero! • APPLES AND ORANGES ? • Geology sees actual fault displacement • Geodesy (primarily) sees transient strain accumulation
Non-uniqueness – Observed– Predicted
Non-uniqueness – Observed– Predicted
Non-uniqueness – Observed– Predicted Fialko, 2006
Non-uniqueness – Observed– Predicted
Conceptual issues Friedrich et al., JGR, 2003; Weldon et al., GSA Today, 2004
Conceptual issues Friedrich et al., JGR, 2003; Weldon et al., GSA Today, 2004 Variable fault loading rate?
Conceptual issues Friedrich et al., JGR, 2003; Weldon et al., GSA Today, 2004 Constant loading rate?
Conceptual issues Weldon et al., 2004
Reconciliation of different slip rates Bennett et al., 2004
Recent hypothesis (weak version): co-varying clusters? – Observed– Predicted Dolan et al., 2007 See also Press and Allen, 1995
Recent hypothesis for present-day behavior: new fault forming – Observed– Predicted Du and Aydin, 1996 Nur et al., 1993 Li and Liu, 2006