Download
1 / 2
20 likes | 182 Views
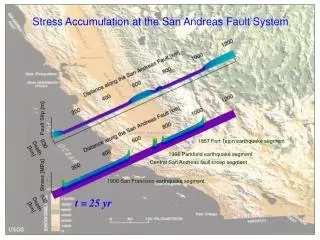
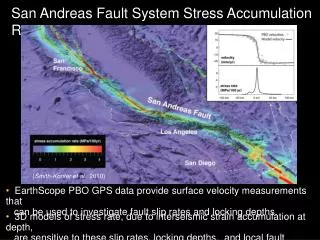
San Andreas Fault System Stress Accumulation Rates. PBO data Model. ( Smith-Konter et al ., 2010). • EarthScope PBO GPS data provide surface velocity measurements that can be used to investigate fault slip rates and locking depths. .

E N D
San Andreas Fault System Stress Accumulation Rates PBO data Model (Smith-Konter et al., 2010) • EarthScope PBO GPS data provide surface velocity measurements that can be used to investigate fault slip rates and locking depths. • 3D models of stress rate, due to interseismic strain accumulation at depth, are sensitive to these slip rates, locking depths, and local fault geometry.
How Does Stress Vary With Depth and Time? SF Peninsula (last quake in1906) Mojave (1857) Coachella (~1690) (full view of model, calendar year 2011) • Models of present-day earthquake cycle stress accumulation are also sensitive to the time since the last major earthquake on each fault segment.