Download
1 / 22
220 likes | 332 Views
This presentation focuses on enhancing the frozen cookie production line by identifying current inefficiencies and bottlenecks. Key areas of concern include variability in production stages, underutilization of resources, standardization issues, and operational delays. The goal is to establish synchronized flows among scaling, mixing, dividing, and packaging processes to improve overall productivity. Feedback and questions are encouraged to refine our project scope and ensure that we have all relevant information to meet our production goals effectively.

E N D
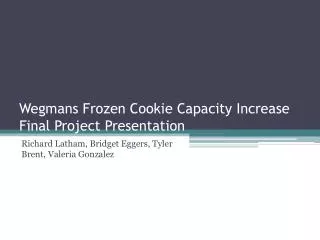
Frozen Cookies Capacity Increase Bridget Eggers, Richard Latham Tyler Brent, Valeria Gonzalez
Presentation Goals Is the current state of our project well defined? Is the information presented relevant to the project goal? Is there any missing information that you believe would be helpful? Feedback and questions are encouraged
Project Scope • Establish synchronized flow between scaling, mixing, dividing and packaging steps in frozen cookie production for optimal productivity. Scaling Stage Mixing Dividing
Defining Current State • Undefined variability in and around the production line • There is a bottleneck between the mixing and dividing steps • Underutilization of resources • Scheduling issues • Use of overtime • Lack of standardization • Production delays
Data Sources • Frozen Bakery Tracking Form- • Actual Packaging Times (Cakes, Muffins, Doughnuts, Frozen Cookies) • APV Commercial Oven Tracking Form • Actual Commercial Oven Times (Commercial Cookies) • Frozen Bakery Tracking Form • Actual Dividing Times (Frozen Cookies) • Weekly production schedules for commercial cookies • Scheduled Commercial Oven Times (Commercial Cookies) • Weekly production schedules for frozen cookies • Scheduled Packaging Times (Cakes, Muffins, Doughnuts, Frozen Cookies) • Frozen Cookie Cycle Times and Recipes • Cookie Capacity & Capability
Seasonal Demand Data Cases
Dividing Station The following timeline shows value-added (colored sections) vs. non-value added (white sections)activities. Each color represents one trough There is not continuous flow within the station
Planned vs. Actual Dividing Time The following graph shows the scheduled vs. the actual time for frozen cookies on the divider
Conclusions • Variability derives from other production lines that are sharing resources • Mixer with Commercial cookies • Blast Freezer with Cakes, Muffins & Doughnuts • Changeover time is not accounted for in scheduling • Planned vs Actual cycle times are not consistent • Labor intensive tasks on Mixer yields high variability in cycle times • Unplanned production adjustments affect scheduled availability of shared resources
Open items & future work Observation on the pre-scaling station Further analysis on commercial line change over times Further analysis on variability in the cake, muffin and doughnut lines Identify most effective and feasible solutions concepts