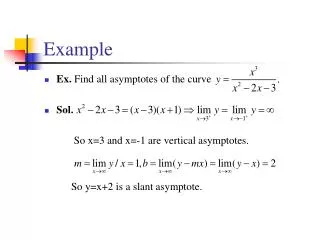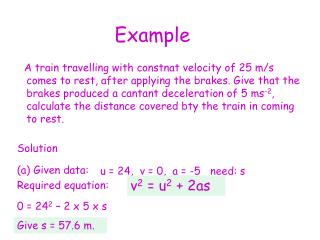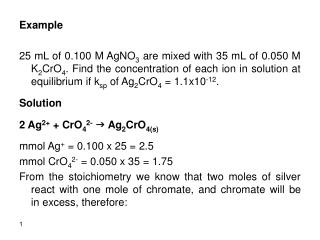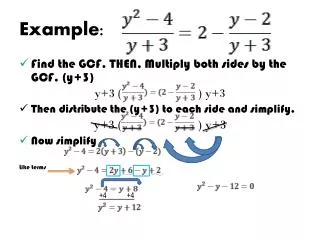
Example:
The goal of every statistical study is to collect data and then use the data to make a decision. Any decision you make using the results of a statistical study is only as good as the process used to obtain the data. If the process is flawed, then the resulting decision is questionable.


Example:
E N D
Presentation Transcript
The goal of every statistical study is to collect data and then use the data to make a decision. Any decision you make using the results of a statistical study is only as good as the process used to obtain the data. If the process is flawed, then the resulting decision is questionable. While you may never have to develop a statistical study, it is likely that you will have to interpret the results of one. And before you interpret the results of a study, you should determine whether or not the results are valid. In other words, you should be familiar with how to design a statistical study.
Take a Census-- A census is a count or measure of an entire population. This type of measurement is often costly and difficult to perform.
A random sample is a sample in which every possible sample of the same size has the same chance of being selected. One way to collect a simple random sample is to assign a different number to each member of the population and then use a random number table like the one in the Appendix. Calculators and computer software programs are also used to generated random numbers.
Example: There are 731 students currently enrolled in statistics at your school. You wish to form a sample of eight students to answer some survey questions. Select the students who will belong to the simple random sample.
Assign numbers 1 to 731 to each student in the course. Onthe table of random numbers, choose a starting place at random and read the digits in the first column in groups of three (because 731 is a three-digit number). For Example, if you start in the third row of the table at the beginning of the second column, you would group the numbers as follows. 719|66 2 |738|6 50|004| 053|58 9|403|1 29|281| 185|44 Ignoring numbers that are greater than 731, the first eight numbers are 719, 662, 650,4,53,589,403, and 129. Students who were assigned these numbers will make up the sample.
Convenience Sample the researcher uses subjects that are convenient or easy to use. (not a good policy)
Observational and Experimental Studies Observational Studies—the researcher merely observes or watches what is happening or what has happened in the past and tries to draw conclusions based on these observations
Experimental Study– the researcher manipulates one of the variables and tries to determine how the manipulation influences other variables
Quasi-Experimental Study– researchers use intact groups (groups that are already formed); treatments are assigned at random; mostly done in education
Independent Variable– one that is is being manipulated by the researcher; also known as the explanatory variable.
Dependent Variable—the resultant variable (what happens); known as the outcome variable; the variable that is studied to see if it has changed significantly due to the manipulation of the independent variable.
In the sit-up study earlier, the researchers gave two different types instructions, general and specific. Therefore, the independent variable is the type of instruction and the dependent variable is the number of sit-ups each group was able to perform after 4 days of exercise.
In experimental studies, there is a treatment group and the control group. The treatment group receives the “special” instruction or the treatment.
Advantages to Experimental Studies The researcher can decide how to select subjects and how to assign them to specific groups. The researcher can manipulate or control the independent variable. Ex. Medicine given—when, how much, change dosage, etc.
Disadvantages to Experimental Studies They may occur in unnatural settings, such as laboratories and special classrooms. Problem? Result may not apply to the natural setting. Hawthorne Effect– when subjects know they are being studied and act differently.
3) Confounding Variable—one that influences the dependent, or outcome variable but was not separated from the independent variable.
Researchers try to control most variables in a study, but this is not possible in some studies. For example, subjects who are put on an exercise program might also improve their diet unbeknownst to the reseacher and perhaps improve their health in other ways not due to exercises alone. Then diet becomes a confounding variable.
Advantages to Observational Studies Usually occurs in a natural setting It can be done in situations where it would be unethical or downright dangerous to conduct and experiment 3) Can be done using variables that can’t be manipulated by the researcher
Disadvantages to Observational Studies Since variables can’t be controlled by the researcher, a definite cause-and-effect situation cannot be shown since other factors may have had an effect on the results. Can be expensive and time-consuming The results could be subject to the inaccuracies of those who collected data