Download
1 / 54
540 likes | 751 Views
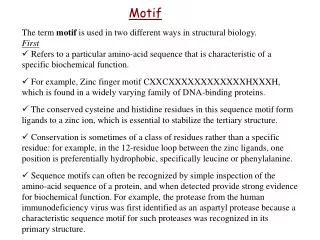
Motif. The term motif is used in two different ways in structural biology. First Refers to a particular amino-acid sequence that is characteristic of a specific biochemical function.

E N D
Motif • The term motif is used in two different ways in structural biology. • First • Refers to a particular amino-acid sequence that is characteristic of a specific biochemical function. • For example, Zinc finger motif CXXCXXXXXXXXXXXXHXXXH, which is found in a widely varying family of DNA-binding proteins. • The conserved cysteine and histidine residues in this sequence motifform ligands to a zinc ion, which is essential to stabilize the tertiary structure. • Conservation is sometimes of a class of residues rather than a specific residue: for example, in the 12-residue loop between the zinc ligands, one position is preferentially hydrophobic, specifically leucine or phenylalanine. • Sequence motifs can often be recognized by simple inspection of the amino-acid sequence of a protein, and when detected provide strong evidence for biochemical function. For example, the protease from the human immunodeficiency virus was first identified as an aspartyl protease because a characteristic sequence motif for such proteases was recognized in its primary structure.
Motif Continued.. • Second • Motif can refer to a set of contiguous secondary structure elements that either have a particular functional significance or define a portion of an independently folded domain. • The elements with the functional sequence motifs are known as functional motifs. An example is the helix-turn-helix motif found in many DNA-binding proteins. • This simple structural motifwill not exist as a stably folded domain if expressed separately from the rest of its protein context, but when it can be detected in a protein that is already thought to bind nucleic acids, it is a likely candidate for the recognition element. Examples - • The Rossmann fold, an alpha/beta twist arrangement that usually binds NAD cofactors; • - The Greek-key motif, an all-beta-sheet arrangement found in many different proteins and which topologically resembles the design found on ancient vases. • As these examples indicate, these structural motifs sometimes are suggestive of function, but more often are not: the only case here with clear functional implications is the Rossmann fold.
Identification of functional peptide in a protein (http://motif.genome.jp/)
Pairwise alignment • The most important question about a gene or protein is whether it is related to any other gene or protein. • Relatedness of two proteins at the sequence level suggests that they are homologous and may have common functions. • Pairwise alignment is the process of lining up two sequences to achieve maximal levels of identity. • By analyzing many DNA and protein sequences, it is possible to identify domains or motifs that are shared among a group of molecules. • These analyses of the relatedness of proteins and genes are accomplished by aligning sequences • The complete genome sequences of many organisms’ and their alignments help us to find how proteins are related within an organism and between organisms. These becomes fundamental to our understanding of life. • Finally, whether two proteins are homologous comes from structural studies in combination with evolutionary analyses.
Protein Alignments are more informative than DNA alignments • Between the choice of aligning a DNA sequence or the sequence of the protein it encodes, comparison of protein sequence is usually more informative. There are several reasons for this – • Many changes in a DNA sequence particularly at the third position of a codon do not change the amino acid that it specified • Many amino acid share related biophysical properties e.g., lysine and arginine are both basic amino acids. The important relationships between related but mismatched amino acids in an alignment can be accounted for using scoring systems. • Protein sequence comparisons can identify homologous sequences from organisms that last shared a common ancestor over 1 billion years ago e.g., glutathione transferase. In contrast, DNA sequence comparisons typically allow lookback times of up to about 600 million years ago. • We can easily move between the worlds of DNA and protein by the tblastn tool from the NCBI BLAST website • Nevertheless, in many cases it is appropriate to compare nucleotide sequences • In searching for polymorphisms • In analyzing the identity of a cloned cDNA fragment
Assesment of two proteins by pairwise alignment • It is possible to asses the relatedness of two proteins by performing a pairwise alignment by placing two sequences directly next to each other. • It is extremely difficult to align these two proteins by visual inspection. • If we allow gaps in the alignment to account for deletions or insertions in the two sequences, the number of possible alignments rises exponentially. • An algorithm can help us to perform an alignment (e.g., heuristic algorithm). GAP program of the genetics computer group (GCG). This program use heuristic algorithm to do this.
Pairwise alignment of human RBP and bovine -lactoglobulin • Along the top row the residues GTWY are all identical between the two proteins. The program also count the number of identical residues, in this case the protein share 26% identity (43 residues). • – identical, 1) paired dots – replacement with similar residues but not identical because they share similar biological properties, Arg (R), Lys (K); 2) Single dots between aligned residues also indicate similarity but less than for paired dots. 3,4) gaps 5) dot above the sequences indicate every 10 bp.
Percent identity and percent similarity • The percent similarity of two protein sequences is the sum of both identical and similar matches. • In the alignment shown before there are 44 aligned amino acid residues of which 11 are identical and 3 are similar. The percent identity is 25% (11/14) and the percent similarity is 32% (14/44). • In general, it is more useful to consider the identity shared by two protein sequences, rather than the similarity, because the similarity measure may be based upon a variety of definitions of how similar two amino acids residues are to each other.
Pairwise Alignment, Homology and Evolution of life • If two proteins are homologous, they share a common ancestor. • Generally, we observe the sequence of proteins from organisms that are extant. • We can compare RBP from species such as human or fish, rainbow trout, and see that the sequences are homologous. • This implies that an ancestral organism had an RBP gene and lived sometime before the divergences of the lineages that gave rise to human and trout. • The study of homologous protein sequences by pairwise alignment involves an investigation of the evolutionary history of that protein.
For the brief overview of the time scale of life on earth we see that the divergence of different species is established through the use of many sources of data, especially the fossil record.
Consider the time scale of life on earth. • Fossils of procaryotes have been discovered in rocks 3.5 billion years old. • In the case of lipocalins, no invertebrate (e.g., insect) ortholog of RBP has been identified, but several fish and amphibian RBPs are known. • So, it can be inferred that the RBP gene originated between 700 and 400 MYA. • Other lipocalins are more ancient like bacterial lipocalin genes presumably arose 2 BYA.
Homologous protein glyceraldehyde-3-phosphate dehydrogenase (GAPDH) enzyme is well conserved through the evolution and very ancient. • Orthologous RBPs from another species provide another example of well conserved family. • Many columns in this alignment are perfectly conserved, including the glycine-X-tryptophan (GXW) motif that is characteristics of lipocalin proteins. • Some positions are less well conserved like immediately preceding the canonical GXW motif, the amino acid may be glutamine, threonine, serine, or alanine. • Amino acid residues that form a binding pocket for retinol are perfectly conserved (showed in arrow). • Despite the tremendous divergence of the amino acid sequences, it is likely that all members of this family adopt a highly similar three-dimensional structure.
DAYHOFF MODEL: ACCEPTED POINT MUTATIONS • Dayhoff and colleagues catalogued thousands of proteins and compared the sequences of closely related proteins in many families. • They considered the question of which specific amino acid substitutions are observed to occur when two homologous protein sequences are aligned. • They defined an accepted point mutation (PAM) as a replacement of one amino acid in a protein by another residue that has been accepted by natural selection. • An amino acid change that is accepted by natural selection occurs when- • a gene undergoes DNA mutation such that it encodes a different amino acid • the entire species adopts that change as the predominant form of the protein
Specific point mutations accepted in protein in evolution: • Dayhoff and colleagues examined 1572 changes in 71 groups of closely related proteins. • Thus their definition of accepted mutations was based on empirically observed amino acid changes. • Conservative replacement such as serine for threonine are most readily accepted during evolution
Dayhoff et al., calculated the relative mutabilities of the amino acids. • This simply describes how often each amino acid is likely to change over a short evolutionary period. • Gonnet and others have produced updates versions of PAM matrices. • They found similar data to that of Dayhoff. Some amino acid residues such as asparagine and serine undergo substitution very frequently while tryptophan and cysteine are mutable only very rarely.
Why are some amino acids more mutable than others? • The less mutable residues probably have important structural and functional roles in proteins, such that the consequence of replacing them with any other residue could be harmful to the organism. • Conversely, the most mutable amino acids – asparagine, serine, aspartic acid, glutamic acid – have functions in proteins that are easily assumed by other residues. The most common substitutions are – glutamic acid for aspartic acid (both are acidic), serine for alanine, serine for threonine (both are hydroxylated), and isoleucine for valine (both are hydrophobic and of a similar size)
Continued.. • The substitutions that occur in proteins can also be understood with reference to the genetic code. For example - • Aspartate is encoded by GAU or GAC, and changing the third position to either A or G causes the codon to encode a glutamic acid • ii) Four of the five least mutable amino acids (Trp, Cys, Phe, Tyr) are specified by only one or two codons. A mutation of any of the three bases of the codon is guaranteed to change that amino acid. The low mutability of this amino acid suggests that substitution are not tolerated by natural selection. • iii) Among the eight least mutable amino acids, only leucine is specified by six codons, and only two (glycine and proline) are specified by four codons.
PAM1 Matrix • Dayhoff and colleagues used the calculated data of accepted point mutations and the probabilities of occurrence of each amino acid to generate a mutation probability matrix M.
Continued.. • Each element of the matrix shows the probability that an original amino acid will be replaced by another amino acid over a defined evolutionary interval. • This interval is one PAM, which is defined as the unit of evolutionary divergence in which 1% of the amino acids have been changed between the two protein sequences. • In conclusion, the evolutionary interval of this PAM matrix is defined in terms of percent amino acid divergence and not in units of years. • For each original amino acid, it is easy to observe the amino acids that are most likely to replace it if a change should occur. These data are very relevant to pairwise sequence alignment because they will form the basis of a scoring system in which reasonable amino acid substitutions in an alignment are rewarded while unlikely substitutions are penalized. • These concepts are relevant to database searching algorithms such as BLAST which depend upon rules to score the relatedness of molecular sequences.
Practical Usefulness of PAM Matrices in Pairwise Alignment • Consider a pairwise alignment of two proteins; human RBP4 and bovine -lactoglobulin and examine the outcome using the PAM40 versus the PAM250 matrix. • The web-based SIM alignment program is suitable for this purpose. • Tools: http://www.expasy.ch • http://www.expasy.ch/tools/sim-prot.html • PAM250 matrix is appropriate because the two proteins are only distantly related. An overlap of 20 identical residues over a span of 81 amino acids is detected (24.7% identity). • Fig 3.16a • PAM40 matrix shows the best aligned segment is only 10 amino acids in length. • Fig. 3.16b • Moreover, the short alignment is biologically meaningless. So, PAM40 matrix is not appropriate for detecting distantly related protein sequences.
BLOSUM scoring matrices • A very common set of scoring matrices is the blocks substitution matrix (BLOSUM) series. • In 1992, Henikoff and Henikoff used BLOCKS database, which consisted of over 500 groups of local multiple alignments (blocks) of distantly related protein sequences. • Thus, the Henikoffs focused on conserved regions (blocks) of proteins that are distantly related to each other. • BLOSUM62 matrix merges all proteins in an alignment that have 62% amino acid identity or greater into one sequence. • If a block of RBP orthologs includes several that have 62, 80 and 95% amino acid identity, these would all be grouped as one sequence. • Substitution frequencies for the BLOSUM62 matrix are weighted heavily by protein sequences having less than 62% identity. • The BLOSUM62 matrix, which is the default scoring matrix used by most BLAST algorithms.
Continued.. • Henikoff and Henikoff tested the ability of a series of BLOSUM and PAM matrices to detect proteins in BLAST searches of databases. • They found that BLOSUM62 perform slightly better than BLOSUM60 or BLOSUM70 and dramatically better than PAM matrices at identifying various proteins • In fact, PAM matrices are based on data from the alignment of closely related protein families, and they involve the assumption that substitution probabilities for highly related proteins (e.g., PAM10) can be extrapolated to probabilities for distantly related proteins (e.g., PAM250). In contrast, BLOSUM matrices are based on empirical observations of more distantly related protein alignments.
Pairwise Alignment and Limits of Detection • If we compare human and trout RBPs, it is very easy to see their close relationship. • However, when we compare human RBP4 to bovine -lactoglobulin, the relationship is much less obvious. Intuitively, at some point two homologous proteins are too divergent to be significantly aligned. • The useful detection limits of pairwise sequence alignment can be explored by comparing the percent identity of the two sequences versus their evolutionary distance. • Consider two protein sequences, each 100 amino acids in length, in which one sequence is fixed and various numbers of mutations are introduced into the other sequence. • A plot of the two diverging sequences has the form of a negative exponential.
If the two sequences have 100% amino acid identity, they have zero changes per 100 residues. • If they share 50% amino acid identity, they have sustained an average of 80 changes per 100 residues. One might have expected 50 changes per 100 residues in the case of two proteins that share 50% amino acid identity. However, any position can be subject to multiple hits. • Thus, percent identity is not an exact indicator of the number of mutations that have occurred across a protein sequence.
Continued.. • When a protein sustains about 250 hits per 100 amino acids, it may have about 20% identity with the original protein, and it can still be recognizable as significantly related. • If a protein sustains 360 changes per 100 residues, it evolves to a point at which the two proteins share about 15% amino acid identity and are no longer recognizable as significantly related. • The PAM250 matrix assumes the occurrence of 250 point mutations per 100 amino acids. This corresponds to the Twilight Zone. At this level of divergence, it is usually difficult to assess whether the two proteins are homologous. • In this case, multiple sequence alignment and structural predictions are sometimes useful to assess homology in these cases.
Tests for statistical significance of Pairwise Alignments • If two proteins share limited amino acid identity (e.g., 20-25%), it is needed to determine whether they are significantly related. • Alignment algorithms report the score of a pairwise alignment or the score of the best alignments of a query sequence against an entire database of sequences. • Statistical tests do decide whether the matches are true positives (i.e., whether the two aligned proteins are genuinely homologous) or whether they are false positives (i.e., whether they have been aligned by the algorithm by chance). • A main goal of alignment algorithms is thus to maximize the sensitivity and specificity of sequence alignments. • Sensitivity is the number of true positives divided by the sum of true-positive and false-negative results. This is a measure of the ability of an algorithm to correctly identify genuinely related sequences. • Specificity is the number of true negative results divided by the sum of true-negative and false positive results. This describes the sequence alignments that are not homologous.
Significance of pairwise alignments • A rule of thumb is that if two proteins share 25% or more amino acid identity over a span of 150 or more amino acids, they are probably significantly related. • If we consider an alignment of just 70 amino acids, it is popular to consider the two sequences significantly related if they share 25% amino acid identity. • In 1998, Brenner et al., have shown that this may be erroneous, because the enormous size of today’s molecular sequence databases increases the likelyhood that such alignments occur by chance. For an alignment of 70 amino acid residues, 40% amino acid identity is a reasonable threshold to estimate that two proteins are homolgous. • If two proteins share about 20-25% identity over a reasonable long stretch (e.g., 70-100 amino acid residues), they are in the “twilight zone”, and it is more difficult to be sure. • Two proteins that are completely unrelated often share about 15-20% identity when aligned. This is especially true because the insertion of gaps can greatly improve the alignment of any two sequences.
x - Z = Statistical significance of global alignments A z-score (a standard score) indicates how many standard deviations an element is from the mean. A Z score is calculated as: Where x is the current score of two aligned sequences, is the mean score of many sequence comparisons using scrambled sequence, and is the standard deviation of those measurements obtained with random sequences. If we need to test the alignment of RBP4 to -lactoglobulin, we first need to align them and obtain a score. We can then scramble the -lactoglobulin sequence 100 times, perform 100 alignments, record the scores and calculate standard deviations. If 100 alignments of shuffled proteins all have a score less than the authentic score of RBP4 and -lactoglobulin, this indicates that the probability (p) value less than 0.01.
Pairwise alignment tools 1) GAP – From the Genetics Computer Group (GCG) URL: http://www.gcg.com 2) BLAST2 sequences – AT NCBI URL: http://www.ncbi.nlm.nih.gov/BLAST/ 3) Pairwise – Two Sequence Alignment Tool URL: http://informagen.com/Applets/Pairwise/ 4) SIM – Alignment tool for protein sequences from ExPaSy URL: http://www.expasy.ch/tools/sim-prot.html
PSI-BLAST Position-Specific Iterated BLAST • A position specific scoring matrix, PSSM, is constructed by calculating position specific scores for each position in the alignment of a multiple alignment • In the highest scoring hits in an initial blast search the PSS is calculated by assigning high scores to highly conserved positions and near zero scores to weakly conserved positions • The profile is then used to perform a second BLAST search and the results of each ‘iteration’ is used to refine the profile. • Thus, PSI-BLAST is highly sensitive homology search program generally used with a query of amino acid sequence against an amino acid sequence database.
BLASTP and PSI-BLAST • PSI-BLAST can beat BLASTP if BLASTP finds some reliable alignments to database sequence • PSI-BLAST can determine the positions in the query sequence that are conserved during evolution and devise an appropriate position-specific scoring matrix which can be used to identify relatives at a further evolutionary distance • If a BLASTP run can’t find any reliable alignment, PSI-BLAST is powerless.
Advantages of PSI-BLAST • PSI-BLAST offers exciting opportunities to discover new types of • relationships in protein databases and use them to infer evolutionary origins • PSI-BLAST will search a protein sequence database with a query • sequence motif, a matrix with rows representing sequence positions and • columns representing variations in that position. • Three advantages –There are some differences between the motifs found • by PSI-BLAST • The motif covers the entire sequence length in PSI-BLAST, whereas • motifs usually cover only a short stretch of the sequences • 2. The same gap penalties are used throughout the procedure and there is no • position specific penalty as in other programs • 3. Each subsequent motif is based on using the query sequence as a master • template to produce a multiple sequence alignment of the same length as the • query sequence
Limitations of PSI-BLAST • The motif found by a PSI-BLAST may be evidence of structural or evolutionary relationships but they could also be due to matching of random variations that have no common origin or function. • Protein structures are comprised of a tightly packed core and outside loops. • Amino acid substitution within the core are common but only certain substitutions will work at a given amino acid position in a given structure. Thus, sequence similarity is not usually a good indicator of structural similarity and the motifs found need to be carefully evaluated before any firm conclusions can be drawn. • PSI-BLAST follows a type of algorithm called Greedy Algorithm. Once additional sequences that match the query are found, they influence the finding of more sequences like themselves and so on. If a different set of query sequences were initially used, a different group with the possible overlaps with the first set may be found. Thus, there is no guarantee that the group finally discovered authentically represents a functional group.
Phylogenetic tree/ Dendogram • A phylogenetic tree or evolutionary tree is a branching diagram or tree showing the inferred evolutionary relationships among various biological species or other entities based upon similarities and differences in their physical and/or genetic characteristics. • The taxa joined together in the tree are implied to have descended from a common ancestor. • The edge lengths in some trees interpreted as time estimates. • Each node is called a taxonomic unit. Internal nodes are generally called hypothetical taxonomic units (HTUs) as they cannot be directly observed.
Distance matrix Distance-matrix methods of phylogenetic analysis explicitly rely on a measure of "genetic distance" between the sequences being classified, and therefore they require an MSA (multiple sequence alignment) as an input. Distance is often defined as the fraction of mismatches at aligned positions, with gaps either ignored or counted as mismatches.
Feng and Doolittle’s progressive sequence alignment • The most commonly used algorithm that produce multiple alignments are derived from the progressive alignment method. • In 1987, Da-Fei Feng and Russell Doolittle proposed this model. • It is called progressive because the strategy entails calculating pairwise sequence alignment scores between all proteins or DNA sequences being aligned. • The alignment begins with the two closest sequences an progressively adding more sequence to the alignment.
Feng and Doolittle’s progressive alignment occur in 3 stages. • Stage 1: The global alignment approach of Needleman and Wunsch is used to create pairwise alignments of every protein that is to be included in a multiple sequence alignment. As shown in the figure, for an alignment of 5 sequences, 10 pairwise alignment are generated. • Algorithm that perform pairwise alignment generate raw similarity scores.
Stage 2: - A guide tree is calculated from the similarity or distance matrix. - There are two principle way to construct a guide tree; the unweighted pair group method of arithmetic averages (UPGMA) and the neighbor joining method. - The two main features of a tree are it’s topology (branching order) and branch lengths (which are proportional to evolutionary distance). - Thus the tree reflects the relatedness of all proteins to be multiply aligned.
Stage 3: • The multiple sequence alignment is created in a series of steps based on the order presented in the guide tree. • The algorithm first selects the 2 most close related sequences from the guide tree and creates a pairwise alignment. • The next sequence is either added to the pairwise alignment or used in another pairwise alignment. • - This procedure is continued progressively until a full alignment is obtained.
Hidden Markov model • Hidden Markov Models (HMMs) provide a powerful tools for alignment. • HMMs are the probabilistic models which describe the likelihood that any amino acid residue occurs at each given position of an alignment. • A profile HMM can convert a multiple sequence alignment into a position specific scoring system. • A common application of profile HMMs is the query of a single protein sequence of interest against a database of profile HMMs. • Another application is to use a profile HMM as the query in database search.
GTWYA GLWYA GRWYE GTWYE GEWFS • Consider the 5 amino acid residues in the conserved GXW region of 5 lipocalins. • - An HMM can be calculated by estimating the probability of occurrence of each amino acid in the 5 positions. • In this senses the HMM approach resembles the Position Specific Scoring Metrics (PSSM) calculation of PSI-BLAST. • From HMM probabilities, a score can be derived for the occurrence any specific pattern of a related query such as, GEWYE. • - The HMM is a model that can described in terms of states at each position of a sequence.
Continued.. • A profile HMM is more complex than PSSM. • It is constructed from an initial multiple sequence alignment to define a set of probabilities. • Along the bottom row is a series of main states (from ‘begin’ to m1-m5 then ‘end’). These states might correspond to residues of an amino acid sequence such as GTWYA. • The sequence row consists of insert states (i1-i5). This states model variable regions in the alignment, allowing sequences to be inserted as necessary. • The third row, at the top consists of circles called delete sates. This corresponds to gaps. • They provide a path to skip a column in the multiple sequence alignment.
Overall the protein sequence of an HMM is defined by a series of states that are connected to each other by state transitions. • Each state has a symbol emission probability distribution for matching a particular amino acid residue. • The symbol sequence of an HMM is an observed sequence that resembles a consensus for the multiple sequence alignment. • There are also state sequences that describe the path followed along the Markov chain.