Download

1 / 34
340 likes | 454 Views
This guide provides an overview of biological motifs, focusing on their definition, representation using Position Specific Scoring Matrices (PSSMs), and methods for scanning motif occurrences within sequences. It covers essential concepts in statistical analysis to control for false discovery rates and emphasizes the importance of Python programming in bioinformatics. The document includes insights on educational feedback, potential improvements in coding practices, and requests for additional Python tutorials. Aimed at students in Genome Sciences and Computer Science, this resource intends to enhance comprehension and application of motifs in research.

E N D
Motif search Prof. William Stafford Noble Department of Genome SciencesDepartment of Computer Science and Engineering University of Washington thabangh@gmail.com
Outline • One-minute response • Revision • Motifs • Definition and motivation • Representation as a PSSM • Scanning for motif occurrences • Python
One-minute responses • I would appreciate a little revision on the two types of tests. • Class was not too fast today. • The new method was fine. • I understood about 50% of the Python part. • The revision was very helpful. • Need more explanation by chalk. • Today was clear. • I am OK with stats but struggling with the Python. • We need to work more on Python. • Can you explain how to control the FDR, the j* and that table of p-values? • I would like to know more about Python execution.
Other comments • We need extra Python tutorials with the tutors. • Tutors should write an explanation of each program so that we understand what it does. • Emile is complaining because our code looks like yours (no main function, not modular). What is the best way to code? • Emile’s comments will not affect your marks – they are stylistic suggestions only.
Revision • You have searched a database of 1000 proteins with a single query sequence. What p-value threshold should you use if you want to apply Bonferroni correction and achieve 99% confidence? • 0.01 / 1000 = 0.00001 • You have searched a database of 5000 proteins, and you observed a top-scoring p-value of 0.00002. What E-value does this correspond to? • 0.00002 * 5000 = 0.1 • How do you decide whether to control the family-wise error rate or the false discovery rate? • If the conclusion or follow-up experiment involves a single result, then control family-wise error rate; otherwise, control false discovery rate.
Revision 0.0001 0.0002 0.0003 0.0004 0.0005 0.0006 0.0007 ... 1 0.0000152 2 0.0001525 3 0.0057250 4 0.0017798 5 0.0025807 6 0.0057372 7 0.0080466 8 0.0104888 9 0.0111517 10 0.0113193 11 0.0121449 12 0.012389 13 0.0136114 14 0.0156425 15 0.0168226 16 0.0172086 17 0.0183523 ... 1000 0.999999 • How many p-values in this list achieve an FDR of 10%? • j = index • α = 0.1 • m = 1000
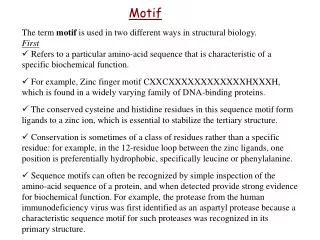
Motif • Set of similar substrings, within a family of diverged sequences. Motif long DNA or protein sequence
Protein motifs HAHU V.LSPADKTN..VKAAWGKVG.AHAGE..........YGAEAL.ERMFLSF..PTTKTYFPH.FDLS.HGSA HAOR M.LTDAEKKE..VTALWGKAA.GHGEE..........YGAEAL.ERLFQAF..PTTKTYFSH.FDLS.HGSA HADK V.LSAADKTN..VKGVFSKIG.GHAEE..........YGAETL.ERMFIAY..PQTKTYFPH.FDLS.HGSA HBHU VHLTPEEKSA..VTALWGKVN.VDEVG...........G.EAL.GRLLVVY..PWTQRFFES.FGDL.STPD HBOR VHLSGGEKSA..VTNLWGKVN.INELG...........G.EAL.GRLLVVY..PWTQRFFEA.FGDL.SSAG HBDK VHWTAEEKQL..ITGLWGKVNvAD.CG...........A.EAL.ARLLIVY..PWTQRFFAS.FGNL.SSPT MYHU G.LSDGEWQL..VLNVWGKVE.ADIPG..........HGQEVL.IRLFKGH..PETLEKFDK.FKHL.KSED MYOR G.LSDGEWQL..VLKVWGKVE.GDLPG..........HGQEVL.IRLFKTH..PETLEKFDK.FKGL.KTED IGLOB M.KFFAVLALCiVGAIASPLT.ADEASlvqsswkavsHNEVEIlAAVFAAY..PDIQNKFSQaFKDLASIKD GPUGNI A.LTEKQEAL..LKQSWEVLK.QNIPA..........HS.LRL.FALIIEA.APESKYVFSF.LKDSNEIPE GPYL GVLTDVQVAL..VKSSFEEFN.ANIPK...........N.THR.FFTLVLEiAPGAKDLFSF.LKGSSEVPQ GGZLB M.L.DQQTIN..IIKATVPVLkEHGVT...........ITTTF.YKNLFAK.HPEVRPLFDM.GRQ..ESLE • Protein binding site • Phosphorylation site • Structural motif
Transcription factor binding Transcription factor binding sites • A transcription factor is a protein that affects transcription by binding to DNA.
Why identify motifs? • In proteins • Identify functionally important regions of a protein family • Find similarities to known proteins • In DNA • Discover how genes are regulated
Representing motifs as PSSMs Convert these 9 6-letter sequences into a PSSM. Use uniform background probabilities (A=0.25, C=0.25, G=0.25, T=0.25) and a pseudocount weight of 1. AAGTGT TAATGT AATTGT AATTGA ATCTGT AATTGT TGTTGT AAATGA TTTTGT A 6 6 2 0 0 2 C 0 0 1 0 0 0 G 0 1 1 0 9 0 T 3 2 5 9 0 7 A 6.25 6.25 2.25 0.25 0.25 2.25 C 0.25 0.25 1.25 0.25 0.25 0.25 G 0.25 1.25 1.25 0.25 9.25 0.25 T 3.25 2.25 5.25 9.25 0.25 7.25 A 0.625 0.625 0.225 0.025 0.025 0.225 C 0.025 0.025 0.125 0.025 0.025 0.025 G 0.025 0.125 0.125 0.025 0.925 0.025 T 0.325 0.225 0.525 0.925 0.025 0.725 A 2.5 2.5 0.9 0.1 0.1 1 C 0.1 0.1 0.5 0.1 0.1 0 G 0.1 0.5 0.5 0.1 3.7 0 T 1.3 0.9 2.1 3.7 0.1 3 A 1.32 1.32 -0.15 -3.32 -3.32 -0.15 C -3.32 -3.32 -1.00 -3.32 -3.32 -3.32 G -3.32 -1.00 -1.00 -3.32 1.89 -3.32 T 0.38 -0.15 1.07 1.89 -3.32 1.54
Scanning for motif occurrences • Given: • a long DNA sequence, and TAATGTTTGTGCTGGTTTTTGTGGCATCGGGCGAGAATAGCGCGTGGTGTGAAAG • a DNA motif represented as a PSSM • Find: • occurrences of the motif in the sequence A 1.32 1.32 -0.15 -3.32 -3.32 -0.15 C -3.32 -3.32 -1.00 -3.32 -3.32 -3.32 G -3.32 -1.00 -1.00 -3.32 1.89 -3.32 T 0.38 -0.15 1.07 1.89 -3.32 1.54
Scanning for motif occurrences A 1.32 1.32 -0.15 -3.32 -3.32 -0.15 C -3.32 -3.32 -1.00 -3.32 -3.32 -3.32 G -3.32 -1.00 -1.00 -3.32 1.89 -3.32 T 0.38 -0.15 1.07 1.89 -3.32 1.54 0.38 + 1.32 – 0.15 + 1.89 + 1.89 + 1.54 = 6.87 • TAATGTTTGTGCTGGTTTTTGTGGCATCGGGCGAGAATAGCGCGTGGTGTGAAAG
Scanning for motif occurrences A 1.32 1.32 -0.15 -3.32 -3.32 -0.15 C -3.32 -3.32 -1.00 -3.32 -3.32 -3.32 G -3.32 -1.00 -1.00 -3.32 1.89 -3.32 T 0.38 -0.15 1.07 1.89 -3.32 1.54 1.32 + 1.32 + 1.07 – 3.32 – 3.32 + 1.54 = -1.39 • TAATGTTTGTGCTGGTTTTTGTGGCATCGGGCGAGAATAGCGCGTGGTGTGAAAG
CTCF • One of the most important transcription factors in human cells. • Responsible both for turning genes on and for maintaining 3D structure of the DNA.
Significance of scores A 1.32 1.32 -0.15 -3.32 -3.32 -0.15 C -3.32 -3.32 -1.00 -3.32 -3.32 -3.32 G -3.32 -1.00 -1.00 -3.32 1.89 -3.32 T 0.38 -0.15 1.07 1.89 -3.32 1.54 Motif scanning algorithm 6.30 Low score = not a motif occurrence High score = motif occurrence How high is high enough? TTGACCAGCAGGGGGCGCCG
Two way to assess significance • Empirical • Randomly generate data according to the null hypothesis. • Use the resulting score distribution to estimate p-values. • Exact • Mathematically calculate all possible scores • Use the resulting score distribution to estimate p-values.
Converting scores to p-values • Linearly rescale the matrix values to the range [0,100] and integerize. A -2.3 1.7 1.1 0.1 C 1.2 -0.3 0.4 -1.0 G -3.0 2.0 0.5 0.8 T 4.0 0.0 -2.1 1.5 A 10 67 59 44 C 60 39 49 29 G 0 71 50 54 T 100 43 13 64
Converting scores to p-values • Find the smallest value. • Subtract that value from every entry in the matrix. • All entries are now non-negative. A -2.3 1.7 1.1 0.1 C 1.2 -0.3 0.4 -1.0 G -3.0 2.0 0.5 0.8 T 4.0 0.0 -2.1 1.5 A 0.7 4.7 4.1 3.1 C 4.2 2.7 3.4 2.0 G 0.0 5.0 3.5 3.8 T 7.0 3.0 0.9 4.5
Converting scores to p-values • Find the largest value. • Divide 100 by that value. • Multiply through by the result. • All entries are now between 0 and 100. A 0.7 4.7 4.1 3.1 C 4.2 2.7 3.4 2.0 G 0.0 5.0 3.5 3.8 T 7.0 3.0 0.9 4.5 A 10.00 67.14 58.57 44.29 C 60.00 38.57 48.57 28.57 G 0.00 71.43 50.00 54.29 T 100.00 42.86 12.85 64.29 100 / 7 = 14.2857
Converting scores to p-values • Round to the nearest integer. A 10.00 67.14 58.57 44.29 C 60.00 38.57 48.57 28.57 G 0.00 71.43 50.00 54.29 T 100.00 42.86 12.85 64.29 A 10 67 59 44 C 60 39 49 29 G 0 71 50 54 T 100 43 13 64
Converting scores to p-values 0 1 2 3 4 … 400 • Say that your motif has N rows. Create a matrix that has N rows and 100N columns. • The entry in row i, column j is the number of different sequences of length i that can have a score of j. A 10 67 59 44 C 60 39 49 29 G 0 71 50 54 T 100 43 13 64
Converting scores to p-values 0 1 2 3 4 … 10 60 100 400 • For each value in the first column of your motif, put a 1 in the corresponding entry in the first row of the matrix. • There are only 4 possible sequences of length 1. A 10 67 59 44 C 60 39 49 29 G 0 71 50 54 T 100 43 13 64 1 1 1 1
Converting scores to p-values 0 1 2 3 4 … 10 60 77 100 400 • For each value x in the second column of your motif, consider each value y in the zth column of the first row of the matrix. • Add y to the x+zth column of the matrix. A 10 67 59 44 C 60 39 49 29 G 0 71 50 54 T 100 43 13 64 1 1 1 1 1
Converting scores to p-values 0 1 2 3 4 … 10 60 77 100 400 • For each value x in the second column of your motif, consider each value y in the zth column of the first row of the matrix. • Add y to the x+zth column of the matrix. • What values will go in row 2? • 10+67, 10+39, 10+71, 10+43, 60+67, …, 100+43 • These 16 values correspond to all 16 strings of length 2. A 10 67 59 44 C 60 39 49 29 G 0 71 50 54 T 100 43 13 64 1 1 1 1 1
Converting scores to p-values 0 1 2 3 4 … 10 60 77 100 400 • In the end, the bottom row contains the scores for all possible sequences of length N. • Use these scores to compute a p-value. A 10 67 59 44 C 60 39 49 29 G 0 71 50 54 T 100 43 13 64 1 1 1 1 1
The probability of observing a score >4 is the area under the curve to the right of 4. This probability is called a p-value. p-value = Pr(data|null) Computing a p-value
Sample problem #1 • Given: • a file containing a length-n DNA sequence, and • a file containing a DNA motif represented as a PSSM of length n. • Return: • the score of the motif versus the sequence A 1.32 1.32 -0.15 -3.32 -3.32 -0.15 C -3.32 -3.32 -1.00 -3.32 -3.32 -3.32 G -3.32 -1.00 -1.00 -3.32 1.89 -3.32 T 0.38 -0.15 1.07 1.89 -3.32 1.54
Sample problem #2 • Given: • a file containing a DNA sequence, and • a file containing a DNA motif represented as a PSSM. • Return: • For each position that scores greater than 0, print the position, the score and the matching sequence A 1.32 1.32 -0.15 -3.32 -3.32 -0.15 C -3.32 -3.32 -1.00 -3.32 -3.32 -3.32 G -3.32 -1.00 -1.00 -3.32 1.89 -3.32 T 0.38 -0.15 1.07 1.89 -3.32 1.54
Sample problem #3 • Modify the previous program to print the same results, but in sorted order, with the greatest score first.