Download
1 / 35
350 likes | 772 Views
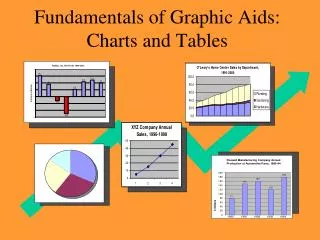
Fundamentals of Graphic Aids: Charts and Graphs. Objectives. Explain the value of graphs in reports Describe the criteria for quality graphs Describe the potential for misleading data Choose the correct graph for different data sets Construct bar graphs, pie charts, and line graphs .

E N D
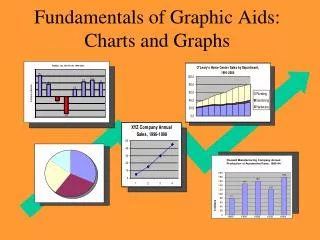
Objectives • Explain the value of graphs in reports • Describe the criteria for quality graphs • Describe the potential for misleading data • Choose the correct graph for different data sets • Construct bar graphs, pie charts, and line graphs
Why use charts? • To help clarify complex data • To supplement text (not substitute text) • To help the reader focus on the data • To simplify the reader’s comprehension
To clarify, supplement, focus, simplify Better ? 1991 1992 1993 1994 1995 1996 1997 1998 1999 2000
To clarify, supplement, focus, simplify BEST ! 1991 1992 1993 1994 1995 1996 1997 1998 1999 2000
Criteria for Quality Graphs 1.Shows the data 2. Helps the reader focus on the data rather than on the graph itself 3. Avoids misleading the reader or distorting the data 4. Simplifies the reader’s comprehension of the data 5. Is consistent with the verbal or numeric description of the data.
You be the judge. Potential for misleading the reader
Two Different Graphs Presenting the Same Information XYZ Company Safety Violations, 1996-1998 XYZ Company Safety Violations, 1996-1998 500 450 400 350 300 250 200 150 100 50 0 50 45 40 35 30 25 20 15 10 5 0 1986 1987 1988 1989 1986 1987 1988 1989
$515 $510 almost unnoticeable scale break $505 $500 0 Oct Nov Dec Two Different Graphs Presenting the Same Information XYZ Company Sales $600 XYZ Company Sales $500 $400 $300 $200 $100 0 Oct Nov Dec
XYZ Company Cost of Operations, 1999-2000 You be the judge. Other Training & Development 5% Material & Capital Development 50% 10% 35% Salaries
Simple Horizontal Bar Chart Western Cable TV Radio Station WROZ-FM Radio Station WKDM-AM 0 2 4 6 8 10 Net Income (millions of dollars)
Expenditures for Real Estate Advertising in Selected Colorado Counties, 1998 Arapahoe County SCALE BREAK $55 Denver County $3.2 million El Paso County $75 0 20 40 60 80 100 Thousands of dollars
Multiple Column Chart 1999 2000 2001
Bilateral Column Chart 1993 1994 1995 1996 1997 1998 1999 2000
Choose the Correct Column or Bar Chart Situation 1: Radkur, Inc. net profit for 8 years 1993 +15.2 million 1994 + 9.0 million 1995 - 3.1 million 1996 - 12.5 million 1997 + 5.3 million 1998 +10.8 million 1999 +12.1 million 2000 + 9.9 million
Choose the Correct Column or Bar Chart Situation 2: Provide the correct graph to depict projected annual sales for XYZ Company for the next 5 years: Year Projected Sales Revenue 1 10.2 million 2 11.1 million 3 11.9 million 4 12.5million 5 13.5 million
Choose the Correct Column or Bar Chart Situation 3: Provide the correct graph to depict projected income of three divisions for XYZ Company for the next 3 years as follows (in millions): Year Division A Division B Division C 1 15.2 5.1 12.7 2 22.4 8.6 14.5 3 26.7 9.5 15.8
Creating a Chart Six main steps to create a chart Specify the data series Select the range of cells to chart Select the chart type Insert the chart and designate the chart location Choose chart options/add graphics in charts Change the chart location and size
Six Steps Specify the data series The rows and/or columns that contain the data you want to chart Select the range to chart Can be a single cell, but most often is multiple cells Cells may be adjacent or non-adjacent Use Shift key to select adjacent cells; use Ctrl key to select non-adjacent cells
Six Steps (continued) Select the chart type Each type presents data in a different way Pick the type that will best visually illustrate the information you want to convey
Six Steps (continued) Insert chart and designate location Insert as an embedded object in the worksheet Can print worksheet and chart on one page Insert the chart as a New Sheet Will require you to print the worksheet and chart on separate pages You can choose the location to display the chart
Six Steps (continued) Choose chart options using the Design, Layout and Format tabs The Design tab can be used to display data in rows or columns The Layout tab can be used to change the display of chart elements The Format tab can be used to apply special effects
Six Steps (continued) Add graphics to chart May add company logos or representative clip art to personalize charts Remember, less is sometimes more, so be sparing in use of graphics
Add a Graphic To add a graphic to a chart: In the Illustrations section on the Insert tab, select the medium where the graphic will come from (Picture, Clip Art, or Smart Art) Search for and insert the graphic Size and move the graphic on the chart as desired
Six Steps (continued) Change the chart location and size Select the chart to reveal sizing handles Drag the sizing handles to achieve desired location and size
Print Charts • You can print a chart: • Including the worksheet in which it is embedded • That is embedded, without printing the worksheet • That was placed on a separate worksheet • Always Print Preview to ensure you are printing what you intended • Select Print from the File menu or click the Print button on the Standard Toolbar