Download
1 / 17
200 likes | 421 Views
Planning for Aircraft Spare Engine and Engine Parts with Simulation. Operations Research and Advanced Analytics IIE, Montréal, Canada, June 3th, 2014. The OR group at AA Who we are and where we came from. S tarted at AA in the 80’s

E N D
Planning for Aircraft Spare Engine and Engine Parts with Simulation Operations Research and Advanced Analytics IIE, Montréal, Canada, June 3th, 2014.
The OR group at AAWho we are and where we came from • Started at AA in the 80’s • Provide analytical consulting and decision support tools for multiple business units • Spin-off with Sabre in 1996, “re-insourced” in 2000 • 36 OR practitioners from 12 countries, 6 continents, 20 languages • 60+ advanced degrees in Operations Research or equivalent • 11 patents and 75+ journal articles published
Outline • Background • Spare Engine Model • Process Modeling & Simulation • Case Studies • Shop Pool Calculator • Process Modeling & Simulation • Case Studies • Conclusion
Background • Airlines own or lease spare engines to cover the operation while engines are overhauled. • Due to the high cost of engines and engine parts, accurate planning can yield significant savings in terms of engine ownership and part inventory cost, e.g., CFM56 engines used in 737 aircraft costs ~ $10M. • Accurate part planning can reduce overhaul time which will also reduce engine ownership. • Due to the complexity of maintenance programs and the uncertainty of engine removal and repair process, we chose to use simulation to determine the engine and the part inventory.
Spare Engine Problem AircraftArrives Engine Removed • How many engines does the company need to own in order to support the completion of the promised flying schedule? “Single Echelon Part Inventory Problem for Repairable Components.” Aircraft to Receive Engine Replacement Removed Engine Sent for Repair Transp. Eng. to Base for Repair Engine SpareRequest Determine Eng. Repair Prgm. Wait for Available Spare to Fulfill Request Repair Select Spare Destination Transport Spare to Station Adjust Spare Level Select NextAircraft for Engine Replacement - + Aircraft in Queue Waiting for Spare Engine Engine Received for Installation Engine Installation Aircraft Exits
The Closed Form Solution • The textbook formula that models both demand and repair time variability would over plan the spare level. The formula assumes one outstanding back order at a time which is clearly violated in the engine repair process. Where L2 and D2 represents the variance of the repair time of the engine and demand, respectively, D is the daily demand rate, L is the engine repair lead time, and k is a point determined from the standard normal distribution depending on the desired service level. • We adjusted the variances to accommodate for the assumption violation for specific repair distributions such as the gamma, Weibull, normal and geometric distribution. A simulation was developed to evaluate these adjustments. • The simulation also allowed us to model more complex but essential processes such as shop capacity and external repair.The simulation was eventually delivered as a software tool to the users.
Simulating the process Determine Repair Program Based on Expected Demand Put Engine in Queue Waiting for Repair Engine Arrives to the Repair Shop Repair Capacity Available? Engine Repair Process(Repair time – Gamma Dist.) Send to Destination Send Next Engine to Repair Process Yes No Repair by Outside Vendor? No External Vendor Repair Process (deterministic) Yes Send to Outside Vendor • Capacity constraints based on number of heavy repairs • Time in queue considered towards pre-intro work • After time in queue, any remaining pre-intro work is added to the repair time
Ownership Calculation • The simulation model’s output corresponds to the variation of the level of spares in time. Through the run of many replications, the ownership is calculated at given service level, or percentile of spare level. Estimating Ownership by Simulation:e.g., the required ownership is obtained from the avg. 10th percentile across multiple simulation replications of the spare level output in steady state, and by subtracting from the initial value. Initial Ownership Warm-up Steady-state Determining required ownership to satisfy a 90% service level
Single or Multi-Location Engine Spare Model • Single location model: when an engine needs a replacement, the aircraft can be routed to a station where a spare engine is available. • Multiple location model: when an engine needs a replacement, a spare engine is needed on the spot. • Most engine types have both “routed” and “on the spot” demand. However, the information is collected. We sometimes run both models to give upper and lower bounds of the spare level.
Multi-Location Model: Dispatch by Highest Stockout Probability Rule • Each request from the distribution centers for a new spare is assigned a stockoutprobability based on the current number of available spares and daily removal rate. The request with the highest probability is chosen to be fulfilled:That is, the probability that in a single day the number of removals is greater than the current number of available spares. • Assuming a Poisson daily removal rate , and let k be the ASC, then the probability of having equal or more available spares than the number of removals X in a single day is given by • Thus, the probability of having more removals X than available spares, i.e., stockout probability, is given by Stock Probability
Measuring Service Level • Service level is traditionally defined as the ratio of successfully satisfied demand at the station (or system-wide) to total number of spare requests received, i.e., “hit or miss.” • Another way to evaluate the performance in the management of the spares is by measuring different metrics related aircraft Out of Service (OTS). • OTS related metrics provide a different perspective of the performance in the field it may be more important to know the expected number of OTS and days under such condition in a given period of time (e.g., in a day, week, year), and/or the duration of such events. • Thus, three type of OTS metrics were defined and tested: (1) OTS-days/year (2) OTS events/year (3) OTS duration statistics
OTS Metrics For The Engine Spare Model (Cont.) • The figure below provides a simple example of OTS metrics measured over a period of 6 days. Spare Levelat Dist. Center OTS Events: 2 OTS-Days: 1 + 2 + 1 = 4 OTS Duration: 3 2 1 0 t 1 2 3 5 4 6 -1 -2 Spares sent from the shops Engine Removal* 2 New Spare Arrival 1 1 0 t 1 2 3 5 4 6 *Whenever an engine removal occurs, then a spare is taken from shelf. If no spare is available, then a request is sent to move an available spare from either the shops or TUL (if possible).
Case Study: Spare Ownership & OTS Metrics • The tables summarize the results obtained for the single-location and multi-location* cases (threshold: No borrowing to 4 spares) • Note: The numbers shown are for illustration purpose only STA 1 STA 1 STA 1 STA 2 STA 2 STA 2 STA 3 STA 3 STA 3 STA 4 STA 4 STA 4 STA 5 STA 5 STA 5 Multi-location cases SL: Service level. *Ownership for the multi-location cases was set to: STA 1 -15, STA 2 -1, STA 3 -0, STA 4 -1, STA 5 -1.
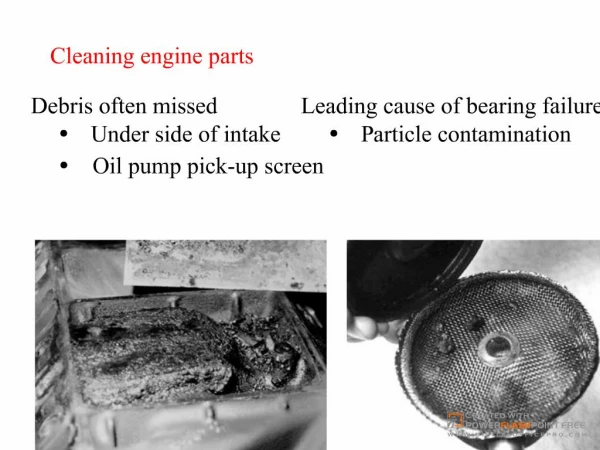
Engine Repair Process • General Engine Repair Process • A typical process map for engine overhaul Engine Shipping Piece Part Repair (PPR) Process Engine Arrival(Intro) Engine Test Assembly Disassembly • Engines are repaired under different repair programs: Light & Heavy • Heavy repairs usually require longer turn-times and are more expensive than the light repairs. TAT Target (collecting parts for assembly)
Background: Engine Spare Parts – Shop Pool • For parts with repair time longer than the allowed piece part repair time, spares are needed so the engine will not wait for the parts. • Such spare part inventory is usually known in the industry as the “shop pool” needed to support the engine repair process (heavy & light repairs). • The shop pool calculation depends on different parameters including: expected demand of engines, part turn-times (repair process), number of parts per engine, repair probabilities. • OR designed both analytical formulas and simulation models that are used to estimate the required ownership of engine parts for the shop pool.
Case Study: Spare Engine Ownership & Shop Pool Investment Spare Ownership vs. Shop Pool Investment • As the TAT decreases, the need for spare engines also decrease, however the investment for shop pool parts increases • The holistic view of the engine repair cost structure helped business to make better decisions about their investments Spare Engine Ownership Additional Shop Pool Investment ($MM)
Conclusion • Inventory planning for expensive asset requires special modeling. • Simulation is a good tool to solve inventory problems for items with complex replenishment processes. Compared to closed form solutions, it can model the processes more accurately with less restrictions. • Savings are significant • As AA upgrades the fleets, the retiring fleets and growing fleets are benefiting from the more accurate planning methodology compared to learning from experience. • For 2012, the Shop Pool inventory of CFM56 engine parts (used in 737 aircraft) calculated with our model would have saved 15% in inventory compared to the manually planned inventory.