Codon Distribution and Genomic Analysis in Triticum, Hordeum, and Brachypodium Chloroplasts
This study examines synonymous codon distribution and genomic locations among chloroplast genomes of Triticum aestivum, Hordeum vulgare, and Brachypodium distachyon. Supplementary Figure 1 shows the correspondence analysis of codon usage, distinguishing between C/G and A/U ending codons. Supplementary Figure 2 visualizes orthologous segments using dot-plot and Chrom-link methods. Supplementary Figure 3 highlights the correlation between synonymous codon usage orderliness (SCUO) and GC composition, providing insights into genomic characteristics across these species.

Codon Distribution and Genomic Analysis in Triticum, Hordeum, and Brachypodium Chloroplasts
E N D
Presentation Transcript
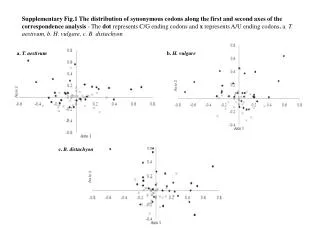
Supplementary Fig.1 The distribution of synonymous codons along the first and second axes of the correspondence analysis - The dot represents C/G ending codons and x represents A/U ending codons. a. T. aestivum, b. H. vulgare, c. B. distachyon a. T. aestivum b. H. vulgare c. B. distachyon
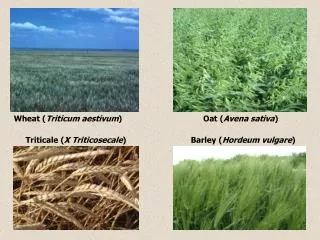
Supplementary Fig.2 Genomic location of orthologous segments – Genomic location of orthologous segments identified among chloroplast genome sequences of T. aestivum, H. vulgare,and B. distachyon are visualized using the GMV program. (A) Dot-plot visualization. (B) Chrom-link visualization. (A) Dot-plot visualization (B) Chrom-link visualization
Supplementary Fig.3 Synonymous codon usage (SCUO) and GC composition - Visualization of the correlation between synonymous codon usage bias and GC measured by synonymous codon usage orderliness (SCUO) and GC composition of the three chloroplast genomes. b. H. vulgare a. T. aestivum c. B. distachyon