Download
1 / 21
210 likes | 303 Views
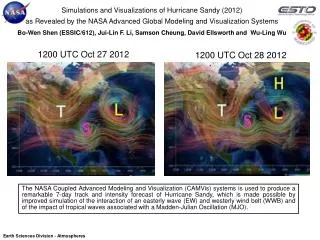
This study focuses on improving tropical cyclone forecasting by exploring the relationship between latent heating and lightning in hurricane intensification. The research employs advanced atmospheric modeling and lightning detection technologies to enhance understanding of these complex processes. By integrating observational data from the Los Alamos Sferic Array (LASA) with computational simulations, the study aims to shed light on the role of various factors in enhancing storm intensity and structure change. The research tools include a VLF-VHF lightning mapping array and a comprehensive atmospheric model that incorporates electrification processes. Through simulations and comparisons with LASA data, the study seeks to provide insights into the mechanisms driving hurricane intensification and the impact of latent heat and lightning on storm dynamics. The research also explores the spatial and temporal scales of heating effects on hurricanes, with a focus on balanced adjustment processes and the potential influence of small-scale lightning details. This study opens new avenues for investigating hurricane physics and addressing key science questions to advance forecasting capabilities.

E N D
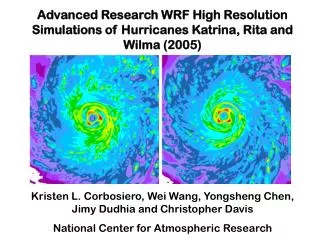
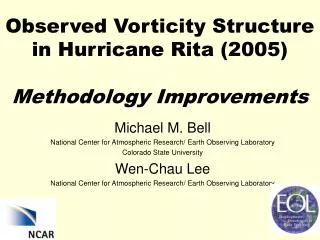
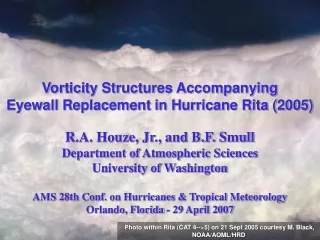
Electrified Simulations of Hurricane Rita (2005) with Comparisons to LASA Data Steve Guimond1,2 , Jon Reisner2, Chris Jeffery2 and Xuan-Min Shao2 1 Florida State University 2 Los Alamos National Laboratory
Motivation • Improve understanding and forecasting of TC intensification • Finish PhD and get a “real” job
Background Vortex Hurricane Intensification Roadmap Updraft Latent Heat Microphysics Eddy Heat and Momentum Fluxes Adjustment Balanced response Asymmetric heating Nolan and Grasso (2003) Intensity and Structure Change Adjustment Adjustment Balanced response Symmetric heating
Motivation • Convective obs hard to come by over ocean • Microwave satellite overpasses intermittent and coarse • Doppler radar coverage very sparse • Lightning fills gaps in convective monitoring ?
Background Vortex Hurricane Intensification Roadmap Updraft Collisions & Charging Lightning Latent Heat Microphysics Eddy Heat and Momentum Fluxes Adjustment Balanced response Asymmetric heating Nolan and Grasso (2003) Intensity and Structure Change Adjustment Adjustment Balanced response Symmetric heating
Motivation • Understand relationship between latent heating and lightning • Heating dynamics • Add energy to system • When • Where • Magnitude • Structure
New Research Tools • Observational component • Los Alamos Sferic Array (LASA; Shao et al. 2000) • Existing VLF/LF array • Records full EMP (allows detection of intracloud and cloud-to-ground strokes) • Lat/Lon, time • New Dual VLF-VHF 4-D lightning mapping array • Deployed along banks of Gulf of Mexico • VLF (~2000 km range) • VHF (~500 km range) • Provides precise height retrieval
New Research Tools • Theoretical component • Advanced atmospheric model HIGRAD (Reisner et al. 2005) • Compressible Navier-Stokes, non-hydrostatic, bulk or explicit microphysics • Differentiable (smooth) numerics with greatly reduced time errors (option) • Coupled to electrification model (Mansell et al. 2005) • Non-inductive collisional charge separation (Saunders) • Lightning discharge model requires significant tuning • Flash initiated when EF exceeds “floor” • What is a good “floor” for hurricanes? • Limit “floor” to ~50 kV/m for reasonable results
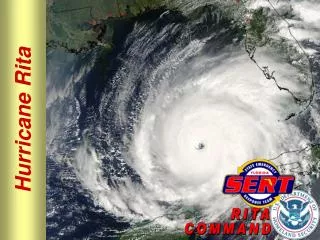
3 Hours Into Simulation Hurricane Rita Simulations • Current configuration • Grid • 1,980 km on a side; 4 km inner mesh, stretch to 20 km • 35 m stretching to 15 km • Relaxation boundary conditions • Weak, top gravity wave absorber • F plane • Initialization procedure • Barotropic vortex, max wind of 40 m/s • Initialize mass from Key West 88D reflectivity • Storm-centered, gridded, native 1 km • Below melting rainwater saturate lower levels • Above melting graupel or snow hydrometeor drag, phase changes • Gaussian water vapor function from eyewall to ~200 km radius • ECMWF operational analyses for large scale • Satellite SSTs, High-res topography
HIGRAD vs. LASA Observations Model
Rainwater mixing ratio Initializing with LASA data
Potentially relevant work • Understand the non-linear response of observed vortices to retrieved heating • Airborne Dual-Doppler Radar: Hurricane Guillermo (1997) • Latent heat retrieval (Guimond 2008) • What spatial/temporal scales of heating does the hurricane “feel” ? • Resolution dependence (i.e. 100 m vs. 2 km) • Impact on azimuthal mean • Balanced adjustment • Are small scale details of lightning necessary to capture intensification? • Governed by model grid cells • Is bulk heating sufficient?
Latent Heating Slice @ z=5 km Realistic Calculation
Summary and Science Questions • New area of research with physics not well understood • Not all deep convection is created equal • Hurricane Initialization • Dual-doppler vortices • Dual-doppler latent heat retrieval • LASA data • How is lightning tied to latent heating (4D)? • What scales matter for the hurricane? • Azimuthal mean sensitive to resolution of heat • ≥ factor of ~4 • Balanced adjustment process
Acknowledgments • LANL Hurricane Lightning Team References • Reisner et al. (2005) • Mansell et al. (2005) • Guimond (2008)
EDOP P-3
Do Eyewall Hot Towers Produce Lightning? • Next slides… • ER-2 Doppler Radar observations of Hot Towers • Linear Depolarization Ratio (LDR) • particle canting angle or asymmetry • dielectric constant (i.e. wet or dry) • Retrieved vertical velocities (nadir beam) • Lightning Instrument Package (LIP) • Aircraft (20 km) electric field mills (x,y,z components) • ~1 s sampling, ~200 m horizontal resolution
Hot Tower #1: CAT 2 Dennis (2005) -8 to -15 dB large, wet, asymmetric ice to large, wet snow aggregates -13 to -17 dB medium, wet graupel or small hail -18 to -26 dB small, dry ice particles to dry, low density snow
Hot Tower #2: CAT 4 Emily (2005) -8 to -15 dB large, wet, asymmetric ice to large, wet snow aggregates -13 to -17 dB medium, wet graupel or small hail -18 to -26 dB small, dry ice particles to dry, low density snow
4 hours into simulation Vertical Velocity (m/s) Ice (g/kg) Graupel (g/kg) Cloud Liquid Water (g/kg) Some Model Results