Download
1 / 32
320 likes | 347 Views
Explore the accuracy of hurricane hindcast simulations through detection and tracking algorithms, experimenting with resolution and convection schemes for more reliable seasonal predictions. Analyzing interannual variability in simulated tropical cyclones.

E N D
Dynamical Seasonal Hurricane Hindcast Simulations Tim LaRow Y.-K. Lim, D.W. Shin, E. Chassignet and S. Cocke CDPW Meeting – October 23, 2007- Tallahassee email: tlarow@coaps.fsu.edu
Outline • Motivation • Previous Studies • Detection/Tracking Algorithm • Experimental Design • Results • Atlantic Domain • Summary/Conclusions/Future
Motivation – Part 1Can We Simulate Interannual Variability? 1997 Observed Tracks 2005 Observed Tracks
Previous Studies • Current climate models can simulate many of the features of • observed tropical cyclones that have spatial scales resolvable • by such models. These include: • Warm core structure (upper-tropospheric anticyclonic • circulation above cyclonic low-level circulation) • Existence of strong upward motion and • Heavy precipitation accompanying the storm • Geographical distributions, intraseasonal, and interannual • variability of simulated storms are similar to observed • (Manabe et al. 1970, Manabe 1990, 1992; Wu and Lau 1992 • Haarsma et al. 1993; Vitart et al. 2006, 2007; • Bengtsson et al. 1982, 1995,2007; • Camargo et al. 2005; Knutson et al. 2007)
Summary from Previous Studies • Modeled tropical cyclones tend to be: • too weak • tracks too short and some have a poleward bias • storms too large and • lack of genesis in certain regions. • Problems in part due to low resolution models used. O(200-400km) – although not the complete story.
Detection Algorithm • Local relative vorticity maximum greater than 4.5x10⁻⁵ s-1is located at 850hPa. • Next, the closet local minimum in sea level pressure is detected and defines the center of the storm. Must exist within a 2°x2° radius of the vorticity maximum. • Third, the closest local maximum in temperature averaged between 200hPa and 500hPa is defined as the center of the warm core. The distance from the warm core center and the center of the storm must not exceed 2°. The temperature must decrease by at least 6K in all directions from the warm core center within a distance of 4°. • Max/Min are located and gradients calculated using bicubic splines which allow for higher precision than the model resolution.
Tracking Algorithm • After the data base of storm snapshots are collected a check is performed to see if there are storms within 200km during the next 6 hours. • If no, the trajectory is stopped. If yes, the closest storm to the previous 6 hours storm's trajectory is picked. If more than one storm is identified, preference is given to storms which are west and poleward of the given location. • Trajectories must last more than 2 days, have lowest model level wind velocity within a 8° radius circle centered on the storm center greater than 17 m s-1 during at least 2 days (does not have to be consecutive days).
Experimental Design Atlantic hurricane season (June-November) hindcast simulations from 1986 to 2005 (20 years). Weekly updated observed SSTs (Reynolds et al. 2002). FSU/COAPS global spectral model – T126L27 resolution ~ 100km 4 member ensembles for each year. Time lagged ECMWF atmospheric initial conditions centered on 1 June of the respective year. A total of 80 experiments. RAS Convective Scheme (Hogan and Rosmond 1991) - Control NCAR (Zhang and McFarlane 1995) Convection Scheme 6 hourly output
Atlantic “HTV” Interannual Variability r=0.78 EL LA EL EL EL EL EL EL LA LA LA LA
Model and Observed TC Tracks 1986-2005 Control Ensemble 1
Sensitivity to Convection Scheme r=0.78 r=-0.01
Sensitivity to Convection - continued NCAR Convection Scheme Control Experiment NCAR NRL
Sensitivity to Convection Scheme - Continued NCAR Convection
“HTV” Landfalls 1986-2005 – Sensitivity to Convection Scheme
Model and Observational Wind-Pressure Relationship-Atlantic Domain FSU/COAPS T126 Model (All 80 Ensemble Members) Knutson et al. 2007, BAMS 18km Non-Hydrostatic Model Wind Pressure Relationship Min slp (hPa) Wind Speed (m/s) 1980-2005 1986-2005 Lowest Pressure 936hPa
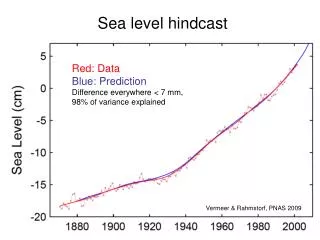
Summary/Conclusions Ensemble hindcast results from a relatively high resolution atmospheric model (T126L27) have been presented for 20-years of the Atlantic Basin hurricane season using 2 different convection schemes. Linear correlation of the interannual variability of the tropical storm frequency against observation was found to be high (0.78) using the Hogan and Rosmond convection, less so for the Zhang and McFarlane convection scheme. Large sensitivity in track locations, storm numbers and interannual variability was found between the two convection schemes and choice of diffusion coefficient (not shown). Model appears to simulate the ENSO-Atlantic covariation well.
Summary/Conclusions - cont. • The model with the best interannual variability was NOT the best in simulating land falling storms along the east coast of the U.S. and Gulf of Mexico. In part due to the atmospheric large-scale response to the model's convection and the resulting large-scale steering flow. • The model's surface wind-pressure relationship was found to be similar to a 20km global model (JMA not shown) and also an 18km non-hydrostatic model (GFDL). All models fail to produce sufficient CAT3-5 level storms in terms of surface winds.
Present Work Better understanding of the sensitivity of tracks and intensity to the choice of convection, diffusion coefficients and tracking algorithm. Use selective years from the hindcast experiments and run the FSU/COAPS regional spectral model to study higher horizontal resolution impacts on hurricane seasonal statistics.