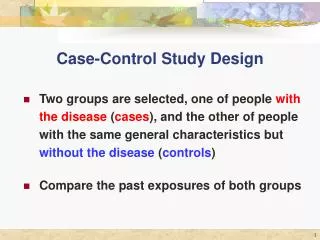
Case-Control Study
Case-Control Study. Chunhua Song 2007.10. Warm up. a. exposed. b. c. unexposed. d. Analysis of Cohort Study. CI(Cumulative Incidence) ID(Incidence Density). RR(Relative Risk,Risk Ratio). AR ARP(Attributable Risk Percent ). PAR PARP(Population Attributable Risk Percent ).

Case-Control Study
E N D
Presentation Transcript
Case-Control Study Chunhua Song 2007.10
a exposed b c unexposed d
Analysis of Cohort Study • CI(Cumulative Incidence) • ID(Incidence Density) • RR(Relative Risk,Risk Ratio) • AR ARP(Attributable Risk Percent ) • PAR PARP(Population Attributable Risk Percent)
In fixed cohort (the status of participants is changeless) number of new cases of a disease during the follow-up period CI= number of participants at the initiation of follow-up
in dynamic population (the status of participants is protean) number of new cases of a disease during the follow-up period ID= total person-time of observation
ratio of the risk (i.e., incidence rate) in an exposed population to the risk in an unexposed, but otherwise similar, population. RR (Relative Risk) Incidence(exposed) RR= Incidence(unexposed)
indicator of the strength (biological significance) of an association between an expose and disease.
RR>1 Research factor is a risk factor (Positive association) RR<1 Research factor is a protective factor (Negative association ) RR=1 No association between the factor and the disease. Incidence(exposed) RR= Incidence(unexposed)
Numbers of cases among the exposed that could be eliminated if the exposure were removed. AR is an estimate of the amount of risk that is attributable to the risk factor after all other known causes of the disease have been taken into account AR (Attributable risk) AR=Ie-I0
Proportion of disease in the exposed population that could be eliminated if exposure were removed. ARP (AR%) (attributable risk percent) Among the E group ,what percentage of the total risk for disease is due to the exposure
Numbers of cases among the general population that could be eliminated if the exposure were removed. PAR (Population Attributable Risk) PAR=It-I0
PARP (PAR%) (population attributable risk percent) • Proportion of disease in the study population that could be eliminated if exposure were removed.
In a study of oral contraceptive use and bacteriauria, a total of 2400 women aged from 16 to 49 years were identified as free from bacteriauria. Of these, 400 were OC users at the initiation. 3 years later,20 of the OC users had developed bacteriauria, 50 of the non-OC users had developed bacteriauria. Based on data above, try to evaluate the association between OC and bacteriauria.
Ie( 3-year period CI )=(20/400) ×100%=5.0% Io( 3-year period CI )=(50/2000) ×100%=2.5% RR=Ie/Io=2 contraceptive use is a risk factor to bacteriauria AR=Ie-Io=2.5% Ie-Io 5%-2.5% ARP= ×100%= =50% Ie 5%
(20+50) It = ×100%=2.9 % 2400 PAR=It-Io=2.9%-2.5%=0.4% It-Io PARP = ×100%=13.8% It
Case-Control Study Postulate of Case-Control Study Types of Case-Control Study Design of Case-Control Study Analysis of Case-Control Study
Postulate of Case-Control Study Case Control Study: Subjects are selected on the basis of whether they have a particular disease or not .The association between the exposure and the disease is evaluated by comparing the two groups with respect to the proportion having a history of an exposure of interest.
c exposure a Case b Case Non-exposure c Control d
Types of Case-Control Study Non-matching Case-Control Study patient Case Sampling Control Non patient
Matching Case-Control Study Matching: Definition: In order to exclude the effect of other factors, control group are required to keep consistent with case group in some aspects. Age Sex Behavior
Smoke -------Lung cancer Smoking
Method: Frequency matching Individual matching Pitman efficiency increase by degrees formula:1:R X=2R / (R+1) R=1, X=1 R=2, X=1.33 R=3, X=1.50 R=4, X=1.6 R=5, X=1.67
Over Matching But if we let risk factors as matching factor, that is ,control group are required to keep consistent with case group in risk factors. We call it as over matching
Smoke -------Lung cancer Smoking
Smoke -------Lung cancer Drinking Sex matching and drinking matching
Smoke -------Lung cancer The exposure factor (smoking) we study is the same between two groups
Design of Case-Control Study 1 Ascertain the research intent 2 Define the disease and fix on the measure method 3 A proper sample size
4 Selection of research subject 4.1 Selection of the case: (1)Hospital-based (2)Community-based representational
4.2 Selection of the control The same source with case If control group is come from hospital, the patient in control group should not suffer from disease that have common causal with the disease of interest. Case lung cancer Control bronchitis
5 Institute questionnaire (1)Selection of variable The factors are relate to the disease and perhaps are the causes of disease (2)Definition of variable (3)Measurement of variable
6 Collection of the research-related information ① Utilize varied routine record ② family interview ③ telephone or correspond inquiry
Analysis of Case-Control Study Non-Matching case control study: Case Control Total exposed a b a+b c c+d unexposed d Total a+c a+b+c+d=n b+d
1 Test whether difference of exposure proportion in 2 groups. Statistics: p-value p<0.05 indicates the likelihood that a study’s findings are due to chance in data analysis
2 Estimate relative risk 2.1 OR(Odds Ratio) Ratio of odds in favor of exposure among cases to odds in favor of exposure among controls.
A case-control study is conducted to reveal the association between oral contraception and MI. There are 150 MI patients and 150 Non-MI patients enrolled in this research. Result is as bellows: Among the 150 MI patients, 50 once used OC, and among the 150 Non-MI patients, 30 once used OC. Try to evaluate the association between OC and MI.
MI Non-MI Total Exposed to OC 50 30 80 220 Unexposed To OC 100 120 Total 150 150 300
1 Test the difference of exposure proportion in 2 groups. P<0.05 . So there is a significant difference of the exposure proportion in 2 groups.
2 Estimate relative risk 2.1 OR(Odds Ratio)
2.2 OR 95%C.I.(confidence interval) =(1.19, 3.36) Taking OC is a risk factor to MI
case control exposure + + a history + - c - + b - - d 1:1 Matching Case Control Study
1:1 Matching Case Control Study Case Total Control Exposed Non- exposed Exposed a a+b b c Non-exposed d c+d a+c n Total b+d
Comparison of cohort and case-control studies • provide information about a range of effects related to a single exposure • Provide information about one effect that afflicts the cases selected(studies including multiple series of cases are an exception)
Comparison of cohort and case-control studies • Typically follow-up studies focus on one exposure • Provide information about a wide range of potentially relevant exposures
Comparison of cohort and case-control studies • Evaluation of effects on rare disease is problematic in follow-up studies. • Evaluation of effects on rare disease are well suited to case-control studies.
Comparison of cohort and case-control studies • Concern is in the follow-up • Concern is in the determination of a correct exposure classification