Download
1 / 52
520 likes | 537 Views
Explore the distribution, abundance, and interactions of organisms within their environments. Learn about population, community, and ecosystem ecology, as well as the cycle of energy and nutrients. Understand population growth, limiting factors, survivorship, and age structure. Study human population growth and its impact on the environment. Discover predator/prey dynamics and competition in ecosystems.

E N D
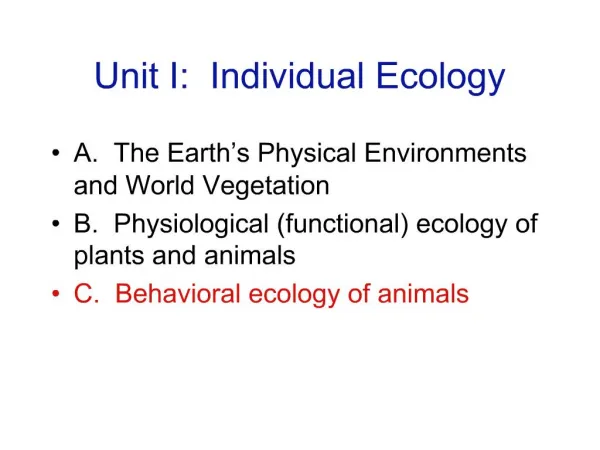
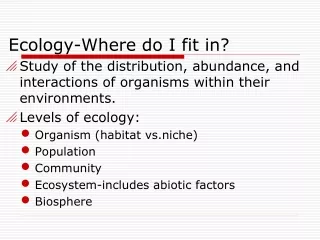
Ecology-Where do I fit in? • Study of the distribution, abundance, and interactions of organisms within their environments. • Levels of ecology: • Organism (habitat vs.niche) • Population • Community • Ecosystem-includes abiotic factors • Biosphere
Organismal ecology Population ecology Figure 50-1 How and why does population size change over time? How do individuals interact with each other and their physical environment? Each female salmon produces thousands of eggs. Only a few will survive to adulthood. On average, only two will return to the stream of their birth to breed Salmon migrate from saltwater to freshwater environments to breed Community ecology Ecosystem ecology How do energy and nutrients cycle through the environment? How do species interact, and what are the consequences? Salmon die and then decompose, releasing nutrients that are used by bacteria, archaea, plants, protists, young salmon, and other organisms Salmon are prey as well as predators
Population Ecology • Demography-the study of populations over time, including categories into which the organism falls • Life expectancy • Immigration/emigration • Density=# individuals/area • Dispersion=where you find the individuals in that area • Population Diagrams 1. Growth Curve- Reproductive rate, r (growth rate) =births-deaths/N N=pop’n size
Growth models • Exponential model-also known as a J curve. Assumes that populations can grow without limit • Logistic model-also known as an S curve. Assumes that populations know what K is, and will act accordingly • Reality-models are only as good as their assumptions, which means that the graph of real population growth is slightly different.
Density dependence: Growth rate slows at high density. Figure 52-7a Carrying capacity Later growth falls to zero Early growth is rapid Growth begins to slow
Limiting factors • Limiting factors are elements of an ecosystem that are in short supply and therefore set limits on population size • Carrying Capacity (K)-maximum number of individuals that can occupy an ecosystem • Density-dependent limiting factors: limiting effects increase as population density increases (ex: disease, famine, etc). • Density-independent limiting factors: limiting effects are not tied to population density (ex: natural disasters, climate, etc)
Population Ecology • Demography-the study of populations over time, including categories into which the organism falls • Life expectancy • Immigration/emigration • Density=# individuals/area • Dispersion=where you find the individuals in that area • Population Diagrams • Logistic Growth Reproductive rate, r (growth rate)= births-deaths/N N=population size 2. Survivorship
Three general types of survivorship curves Figure 52-2a High survivorship Type I Low survivorship Type II Steady survivorship Low survivorship Type III High survivorship
Population Ecology • Demography-the study of populations over time, including categories into which the organism falls • Life expectancy • Immigration/emigration • Density=# individuals/area • Dispersion=where you find the individuals in that area • Population Diagrams • Reproductive rate, r (growth rate)=births-deaths/N N=population size • Survivorship • Age Structure=Bar graph showing ages and genders of individuals in the population
Figure 52-15 Developed country (Sweden) Developing country (Honduras) 2050 projections 2050 projections 2000 data 2000 data
Developed Country • All groups in the age structure are nearly equal. Slow or no growth. • Available health care and education • High GDP (gross domestic product) • Developing Country • The majority of individuals are reproductive age or lower. Rapid Growth. • Inconsistent health care and education • Low GDP
Random Sampling of Populations How do we study populations that are too large to manage????
Human Population growth • Human population worldwide is reaching 9 billion. It was just 3 billion 100 years ago. • Why the rapid rise? • Increases in food supply and travel • Reduction in waste related issues and disease • Expansion of habitat • All environmental problems can be tied to human population growth. • http://www.greenbiz.com/video/2012/07/03/can-we-feed-world-without-destroying-planet • List 2 reasons why agriculture is our “largest ecologic challenge” • Select 1 of the solutions discussed and explain the importance. • 11 minutes
Community Ecology 1. Predator/Prey • The population change is similar since they are dependent on each other. • The prey are usually predators of producers, so their population changes are often due to seasonal changes in their “prey” population. • Calculate lag time
Figure 52-12 The hare-lynx populations cycle every 11 years, on average; the size of the lynx population lags behind that of the hares Lynx Hare
Community Ecology 2. Competition • Gause’s principle of competitive exclusion=when 2 species try to occupy the same niche, there will be competition until one species leaves or dies • Resource partitioning=species can coexist even though they appear to be competing for the same resources. They are occupying slightly different niches, using the resources in different waysor only have slight overlap.
Figure 53-4a Competitive exclusion in two species of Paramecium Paramecium aurelia Paramecium caudatum
One species eats seeds of a certain size range. Figure 53-3 Partial niche overlap: competition for seeds of intermediate size Species 2 Species 1
3. Symbiosis-living together but not in a trophic relationship • In a symbiotic relationship, organisms closely associate with one another. There are 3 types of symbiosis: • Co-evolution is often a result of symbiosis.
4. Trophic Relationships • These are the feeding relationships in an ecosystem. • Food chain: producerprimary consumersecondary consumertertiary consumers • Decomposers can feed at any level. • Recall the following terms: carnivore, herbivore, omnivore • Energy transfer between trophic levels is inefficient-only 10% of the energy is transferred. • This affects biomass and the numbers at each level.
Trophic level Decomposer food chain Feeding strategy Grazing food chain Figure 54-5 Quaternary consumer 5 Cooper’s hawk Tertiary consumer 4 Robin Cooper’s hawk Secondary consumer 3 Robin Earthworm Primary decomposer or consumer 2 Bacteria, archaea Cricket Primary producer 1 Dead maple leaves Maple tree leaves
Figure 54-6 Cooper’s hawk Fox Robin Alligator lizard Arrows show direction of energy flow: from organism consumed to consumer Earthworm Millipede Insect larvae (maggots) Bacteria, archaea (many species) Cricket Puffball Pillbugs Bracket fungus Dead animals (many species) Maple tree leaves Dead leaves (many species) Rotting log
Figure 54-7 Production of biomass (g/m2/year) 3 Tertiary consumers 10% Efficiency of energy transfer Secondary consumers 30 15% 20% Primary consumers and decomposers 200 Primary producers 1000
Primary Productivity • This is the amount of light energy converted to chemical energy in an ecosystem. • Gross Primary productivity is the total primary productivity of the ecosystem • Net Primary productivity is the gross primary productivity - the energy used by producers for respiration (R) • Formula for net primary productivity: • NPP=GPP-R
Owl Pellet Lab • http://www.kidwings.com/owlpellets/pelletform/index.htm • Part 2 (use the graph provided in your plastic sheet to determine the Estimated Animal Mass) Posting: • Background on owl digestion and pellet formation • Data-length, width and mass of your pellet, Jaw Data Table • Conclusion-Part 2 question #5 and #6
Biodiversity • This is also called species diversity and can be discussed in terms of • Species richness-number of different species in the community • Relative abundance of different species in the community • This is a measure of heath of a community.
Figure 53-25 Community 2 Community 3 Community 1 A B C Species D E F Species richness: 6 6 5 Species diversity: 0.59 0.78 0.69
High Impact Species in Communities • Keystone Species-These are not necessarily abundant in a community, but play a part in many interactions within the community. You can tell a keystone species by removing it from the ecosystem and viewing the impact. (ex: sea otters, if removed do not keep sea urchins in check, and there is less kelp) • Invasive Species-These are species that invade (usually by being introduced by humans) an ecosystem and replace the species that are naturally there • Dominant Species-These are the most abundant species in an ecosystem, and have the most biomass • Foundation Species-These are also called “ecosystem engineers”. They cause physical changes in their environments. Ex. Beavers
Ecosystem Ecology • Biogeochemical Cycles- the flow of important elements through the ecosystem. • Hydrologic cycle-mainly an abiotically-driven cycle. • Reservoirs-ocean, air, groundwater, glaciers • Assimilation-plants absorb water from the soil, animals drink water and eat organisms • Release-transpiration, evaporation, etc. • Carbon cycle-mainly biotically-driven and tied to atmospheric CO2 levels that cause the greenhouse effect • Reservoirs-atmosphere, fossil fuel, peat, organic material (like cellulose) • Assimilation-photosynthesis, animals eating plants and each other • Release-respiration and decomposition • Nitrogen cycle-also a biotically driven cycle dependent heavily on bacteria • Reservoirs-atmospheric N2, soil (nitrates, nitrites, ammonia) • Assimilation-nitrogen fixation by bacteria, nitrification by bacteria • Release- decomposition of dead organisms and animal waste
In your notes, write a haiku about one cycle: • Water, Carbon, Nitrogen • 8 minutes • Remember syllables should be 5/7/5 By Owen Ulrich smallest living thingliving, growing, dividingthe base of all life
Biomes • These are ecosystems that have characteristic biotic and abiotic factors • Land Biomes are largely determined by latitude (except desert) • As you move from the poles toward the equator, biodiversity and biomass increase. The length of the growing season also increases. • This determines the climax community. • Water Biomes are determined by salinity and depth • Climatograph activity.
Ecosystem Ecology • Biogeochemical Cycles-this is the flow of important elements through the ecosystem. • Hydrologic cycle-mainly an abiotically-driven cycle. • Reservoirs-ocean, air, groundwater, glaciers • Assimilation-plants absorb water from the soil, animals drink water and eat organisms • Release-transpiration, evaporation, etc. • Carbon cycle-mainly biotically-driven and tied to atmospheric CO2 levels that cause the greenhouse effect • Reservoirs-atmosphere, fossil fuel, peat, organic material (like cellulose) • Assimilation-photosynthesis, animals eating plants and each other • Release-respiration and decomposition • Nitrogen cycle-also a biotically driven cycle dependent heavily on bacteria • Reservoirs-atmospheric N2, soil (nitrates, nitrites, ammonia) • Assimilation-nitrogen fixation by bacteria, nitrification by bacteria • Release-denitrification by bacteria, decomposition, animal waste • Phosphorous cycle-again, a biotically-driven cycle • Reservoirs-rocks and ocean sediments • Assimilation-plants absorb phosphates and are eaten by animals • Release-decomposition, animal waste
Figure 54-13 THE GLOBAL WATER CYCLE All values in 1018 grams per year Net movement of water vapor by wind: 36 Precipitation over ocean: 283 Evaporation, transpiration: 59 Evaporation from ocean: 319 Precipitation over land: 95 Percolation Runoff and groundwater: 36 Water table (saturated soil)
Figure 54-14 THE GLOBAL CARBON CYCLE All values in gigatons of carbon per year Atmosphere: 778 (during 1990s) Net uptake via photosynthesis by plants: 3.0 Land-use change (primarily deforestation): 1.6 Net uptake via photosynthesis, chemical processes: 1.5 Fossil-fuel use: 6.3 Organisms, soil, litter, peat: 2190 Rivers (erosion): 0.8 Organisms, chemical processes in ocean: 40,000 Terrestrial ecosystems Aquatic ecosystems Human-induced changes
Figure 54-16 THE GLOBAL NITROGEN CYCLE All values in gigatons of nitrogen per year Atmospheric nitrogen (N2) Industrial fixation: 100 Protein and nucleic acid synthesis Bacteria in mud use N-containing molecules as energy sources, excrete N2: 310 Lightning and rain: 3 Internal cycling: 1200 Nitrogen-fixing bacteria in roots and soil: 202 Nitrogen-fixing cyanobacteria: 15 Internal cycling: 8000 Runoff: 36 Decomposition of detritus into ammonia Mud Permanent burial: 10
Figure 54-3 Area covered, by ecosystem type NPP per unit area Total NPP Aquatic Terrestrial
Human Impact on the Biosphere • Human activity over time has been damaging to the biosphere. • Ecology is really a study of balance, and as the human population has grown, our wastes and byproducts have thrown off that balance. • There have been, in recent years, efforts to reestablish the balance and conserve our resources. • Ex: Prior to the 1980s, CFCs were common propellants used in household goods. As a result of human use of CFCs, they built up in the atmosphere, reacting with ozone (O3), and causing holes in the ozone layer. This layer surrounds the planet and shields us from damaging UV radiation. As a result of banning CFCs, and using safer alternatives, the holes in the ozone layer are repairing themselves.
Climate change • Human activities have caused a buildup of CO2 in the atmosphere. Of course, CO2 is a greenhouse gas, which means that we have additional heat building up in our atmosphere • Data indicates that the world is getting warmer, which sparks many problems like raising sea levels, changing weather patterns that could decrease agricultural output, change the trophic structure of our oceans and land
Recent changes in atmospheric CO2 recorded in Hawaii Figure 54-15b At Mauna Loa, atmospheric CO2 concentrations are high in winter and low in summer, forming annual cycles
Figure 54-19 Cold-water copepods are declining in the North Atlantic. Flowering times for some species in midwestern North America are earlier in the year. Great Britain Cold-water copepods Warm-water copepods Baptista flowers
Figure 54-21 Much of the ocean is stratified by density and temperature. Global warming increases the density gradient, making it less likely for layers to mix. Surface layer: Water is much warmer, less dense Surface layer: Water is warm, less dense Currents are less likely to bring nutrient-rich water to surface, against the steeper density gradient Much steeper density gradient Nutrient-rich water is brought to the surface by currents Density gradient Benthic zone: Water is 4°C, highest density Benthic zone: Water is 4°C, highest density
Pollution • Obviously, this causes destruction of water, air, and land resources, as they become fouled by waste. • This has obvious negative side-effects for orgnisms on the planet, but there are 2 important issues associated with pollution that aren’t always discussed. • Biological magnification-while energy decreases as it moves up the food chain, pollutants and toxins, like DDT, concentrate. • Eutrophication-believe it or not, this IS a bad thing. Over-fertilization nourishes the water, causing algal blooms. Not only can these be toxic to animals, but they are r-strategists, so they die, sink, and are decomposed at the bottom of bodies of water (mainly freshwater). Decomposition is an oxygen-consuming process, which leaves the bottom waters anoxic, causing fish-kills
Other Environmental Problems • Acid Rain-Sulphur-containing compounds belched from smokestacks turn into sulphuric acid in the atmosphere • Deforestation-clear-cutting of forests for logging and expanding human population. This is particularly bad b/c the nutrients in tropical rain forests are in the canope. • Desertification-overgrazing of grasslands bordering deserts turns these into deserts. • All of these can lead to endangerment of or reduction in species and biodiversity.
Figure 55-10 Satellite view of deforestation in Rondônia, Brazil The devastation of deforestation 2001 1975