Download

1 / 24
260 likes | 940 Views
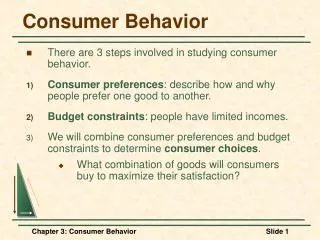
CONSUMER BEHAVIOR. Mikro Ekonomi. QUIZ. Draw the graph and explain it! Indifference curve Budget line What is utility concept? Explain! What is law of diminishing marginal utility? Explain!. FIGURE II.1 Firm and Household Decisions.

E N D
CONSUMER BEHAVIOR MikroEkonomi
QUIZ • Draw the graph and explain it! • Indifference curve • Budget line • What is utility concept? Explain! • What is law of diminishing marginal utility? Explain!
FIGURE II.1Firm and Household Decisions Households demand in output markets and supply labor and capital in input markets. To simplify our analysis, we have not included the government and international sectors in this circular flow diagram. These topics will be discussed in detail later.
INTRODUCTION • Every household must make three basic decisions: • How much of each product, or output, to demand • How much labor to supply • How much to spend today and how much to save for the future
PENGERTIAN DAN ASUMSI UTAMA • Utility The satisfaction a product yields. • Barangbendadanjasa yang dikonsumsiuntukmemerolehmanfaatataukegunaan. • Transitivitykemampuankonsumenmenyusunprioritaspilihan agar dapatmengambilkeputusan. • Perfect knowledgememilikiinformasiataupengetahuan yang sempurnaberkaitandengankeputusankonsumsinya.
TEORI KARDINAL • Total utility The total amount of satisfaction obtained from consumption of a good or service. • Marginal utility (MU) The additional satisfaction gained by the consumption or use of one more unit of a good or service. • Law of diminishing marginal utility The more of any one good consumed in a given period, the less satisfaction (utility) generated by consuming each additional (marginal) unit of the same good.
TEORI KARDINAL FIGURE 6.3Graphs of Frank’s Total and Marginal Utility Marginal utility is the additional utility gained by consuming one additional unit of a commodity—in this case, trips to the club. When marginal utility is zero, total utility stops rising.
THE UTILITY-MAXIMIZING RULE • Utility-maximizing rule Equating the ratio of the marginal utility of a good to its price for all goods. • Diamond/water paradoxA paradox stating that (1) the things with the greatest value in use frequently have little or no value in exchange and (2) the things with the greatest value in exchange frequently have little or no value in use.
THE UTILITY-MAXIMIZING RULE • In general, utility-maximizing consumers spread out their expenditures until the following condition holds: • where MUX is the marginal utility derived from the last unit of X consumed, MUY is the marginal utility derived from the last unit of Y consumed, PX is the price per unit of X, and PY is the price per unit of Y.
TEORI ORDINAL Budget constraint The limits imposed on household choices by income, wealth, and product prices. Choice set or opportunity set The set of options that is defined and limited by a budget constraint.
THE BUDGET CONSTRAINT • Preferences, Tastes, Trade-Offs, and Opportunity Cost • Within the constraints imposed by limited incomes and fixed prices, households are free to choose what they will and will not buy. • Whenever a household makes a choice, it is weighing the good or service that it chooses against all the other things that the same money could buy. • As long as a household faces a limited budget—and all households ultimately do—the real cost of any good or service is the value of the other goods and services that could have been purchased with the same amount of money.
THE BUDGET CONSTRAINT Real income The set of opportunities to purchase real goods and services available to a household as determined by prices and money income. A budget constraint separates those combinations of goods and services that are available, given limited income, from those that are not. The available combinations make up the opportunity set.
THE BUDGET CONSTRAINT • The Equation of the Budget Constraint In general, the budget constraint can be written PXX + PYY = I, where PX = the price of X, X = the quantity of X consumed, PY = the price of Y, Y = the quantity of Y consumed, and I = household income.
THE BUDGET CONSTRAINT Budget Constraints Change When Prices Rise or Fall When the price of a good decreases, the budget constraint swivels to the right, increasing the opportunities available and expanding choice.
Diminishing Marginal Utility and Downward-Sloping Demand At a price of $40, the utility gained from even the first Thai meal is not worth the price. However, a lower price of $25 lures Ann and Tom into the Thai restaurant 5 times a month (The utility from the sixth meal is not worth $25). If the price is $15, Ann and Tom will eat Thai meals 10 times a month—until the marginal utility of a Thai meal drops below the utility they could gain from spending $15 on other goods. At 25 meals a month, they cannot tolerate the thought of another Thai meal even if it is free.
THE INCOME EFFECT • Price changes affect households in two ways. First, if we assume that households confine their choices to products that improve their well-being, then a decline in the price of any product, ceteris paribus, will make the household unequivocally better off. • In other words, if a household continues to buy the same amount of every good and service after the price decrease, it will have income left over. That extra income may be spent on the product whose price has declined, hereafter called good X, or on other products. • The change in consumption of X due to this improvement in well-being is called the income effect of a price change.
THE SUBSTITUTION EFFECT • When the price of a product falls, that product also becomes relatively cheaper. That is, it becomes more attractive relative to potential substitutes. A fall in the price of product X might cause a household to shift its purchasing pattern away from substitutes toward X. This shift is called the substitution effect of a price change. • Everything works in the opposite direction when a price rises, ceteris paribus. When the price of a product rises, that item becomes more expensive relative to potential substitutes and the household is likely to substitute other goods for it.
INDIFFERENCE CURVES • We base the following analysis on four assumptions: • We assume that this analysis is restricted to goods that yield positive marginal utility, or, more simply, that “more is better.” • The marginal rate of substitution is defined as MUX/MUY, or the ratio at which a household is willing to substitute X for Y. We assume a diminishing marginal rate of substitution. • We assume that consumers have the ability to choose among the combinations of goods and services available. • We assume that consumer choices are consistent with a simple assumption of rationality.
INDIFFERENCE CURVES An indifference curve is a set of points, each representing a combination of some amount of good X and some amount of good Y, that all yield the same amount of total utility. The consumer depicted here is indifferent between bundles A and B, B and C, and A and C. Because “more is better,” our consumer is unequivocally worse off at A' than at A.
INDIFFERENCE CURVES Each consumer has a unique family of indifference curves called a preference map. Higher indifference curves represent higher levels of total utility. The slope of an indifference curve is the ratio of the marginal utility of X to the marginal utility of Y, and it is negative.
INDIFFERENCE CURVES Consumers will choose the combination of X and Y that maximizes total utility. Graphically, the consumer will move along the budget constraint until the highest possible indifference curve is reached. At that point, the budget constraint and the indifference curve are tangent. This point of tangency occurs at X* and Y* (point B).
INDIFFERENCE CURVES Deriving a Demand Curve from Indifference Curves and Budget Constraints • Indifference curves are labeled i1, i2, and i3; budget constraints are shown by the three diagonal lines from I/PY to I/PX1, I/PX2 and I/PX3. • Lowering the price of X from PX1to PX2 and then to PX3 swivels the budget constraint to the right. • At each price, there is a different utility-maximizing combination of X and Y. • Utility is maximized at point A on i1, point B on i2, and point C on i3. • Plotting the three prices against the quantities of X chosen results in a standard downward-sloping demand curve. I
REFERENCES • Case, Karl E., Ray C. Fair & Sharon M. Oster. 2013. Principles of Economics. Pearson Education Limited. • Rahardja, Pratamadan Mandala Manurung. 2010. TeoriEkonomiMikro: SuatuPengantar. Jakarta: LPFE-UI.