Download
1 / 36
360 likes | 441 Views
Explore a stressor-based approach to monitor and assess key stressors impacting estuaries using indicators and a risk assessment framework for effective management. Includes benefits, monitoring sites, and examples. Contact David Scheltinga at EPA for more information.

E N D
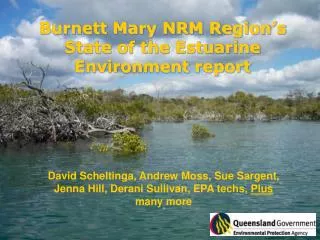
Burnett Mary NRM Region’s State of the Estuarine Environment report David Scheltinga, Andrew Moss, Sue Sargent, Jenna Hill, Derani Sullivan, EPA techs, Plus many more
Stressor based approach Stressors: Aquatic sediments Bacteria/pathogens Biota removal/disturbance Freshwater flow regime Habitat removal/disturbance Hydrodynamics Litter Nutrients Organic matter Pest (plant, animal) species pH Toxicants What are key stressors impacting on estuaries?
Steve Posselt Pests
Human activity Direct pressure Pressure mediating factors – e.g. Farm BMP, zero till, trash blanketing % ground cover Sediment load Phys-chem state Biological impact Estuary’s ‘intrinsic’ mediating factors – e.g. its length and tidal range Turbidity % cover seagrass Framework logic – Cause and Effect e.g. Stressor ‘sediments’
Vulnerability score Pressure indicator score X Overall estuary risk score Overall estuary health score Comparison against thresholds Stressor Risk score Stressor 1 Condition score Score adjusted Stressor 2 Condition score Stressor ranking Condition indicator 1 score Condition indicator 2 score Comparison against thresholds Score boost Indicator weighting Raw data Raw data Comparison against thresholds Assessment and Scoring
Benefits of the framework • Numerous benefits for decision support • Allows the identification of the key pressures in the area • which can help identify what the key condition indicators to monitor are (i.e. only monitor relevant indicators) • which can then be the targets of management actions • Allows justification for why and where did management work
Benefits of the framework • Is relatively cheap and easy to perform ‘risk’ analysis • Pressure indicators will respond to management action much earlier than condition indicators • Identify the causes and effects, making it easier to identify appropriate management actions • Can be used for various reporting needs • Report on dependability and confidence
9 new estuaries monitored by BMRG 10 additional sites monitored by EPA and funded by BMRG Sites
What is being monitored • 37 condition, 51 pressure and 7 vulnerability indicators • Started April 2007 • Currently have information on about 75% • Finish May 2008 and report soon after
pest species in adjoining areas stormwater
commercial and recreational fisher usage port/harbour/marina and boating activity
Photo NRW Unsealed road density
Google Earth Riparian vegetation Tidal barrage; estuary loss Photo SEQ Catchments impoundment density
Clear runoff Turbid runoff Photo NRW
Experiment at Mt Mort near Ipswich Results from a 54mm storm Matching stocking rates to pasture availability is the key to effective management in grazing lands Finlayson and Silburn, 1996
mangrove extent Google Earth seagrass extent, % cover and % epiphytic growth saltmarsh extent
bacteria counts toxicants in sediments toxicants in water
chlorophyll-a and nutrients pH, DO, turbidity
Presence of litter Accumulation rate of litter
Neuse River, USA - http://switchstudio.com/waterkeeper/issues/Spring%2007/neuse.html mass mortality events red-spot disease Photo QASSIT, NRW
Example – vulnerability • natural water clarity • flushing rate • presence of conservation areas • tidal range • resuspension rate
Mary River Kauri Creek
Summary • A way forward is being developed (slowly) for integrating agency, local authority and community monitoring data • Advantages to all parties by working cooperatively – sharing resources, knowledge, methods, QA, etc. • Both able to make good use of the data (provided that the quality is good) • to compare with guidelines • data used to establish a baseline for estuaries • QA important if data is to be of real use – the direct involvement of the EPA helps to ensure this • Get outcomes that are useful to all (improved health) • Provided that all parties do their bit properly and comprehensively
Contact David Scheltinga EPA david.scheltinga@epa.qld.gov.au (07) 3896 9242