Download
1 / 34
340 likes | 452 Views
Miracles or Magic – An assessment of Physical and Virtual Water Flows in China. Index Chinese miracles China’s water facts International trade theories Virtual water flows Drivers of Chinese water crisis Conclusions. Dr Dabo Guan

E N D
Miracles or Magic – An assessment of Physical and Virtual Water Flows in China Index • Chinese miracles • China’s water facts • International trade theories • Virtual water flows • Drivers of Chinese water crisis • Conclusions Dr Dabo Guan Senior Lecturer in School of Earth and Environment, University of Leeds Senior Member and Director of Studies, St Edmunds College, University of Cambridge
Chinese love miracles ‘Poverty’ ‘Adequate food and cloth’ ‘Well to do’ ‘Industry’ ‘Services’ ‘Agriculture’ ‘Poor education’ ‘9 yrs free school’ ‘too many PhDs’
China’s Miracle ‘Wenchuan, 2008 earthquake aftermath’ ‘Wenchuan, 2010 completion of re-construction’ So, aluminium processing Small scale power plants Large scale ones with better technology This is low carbon development in China! Low Carbon Development in the least developed region: A case study of Guangyuan, Sichuan province, southwest China” Natural Hazards, forthcoming 2011
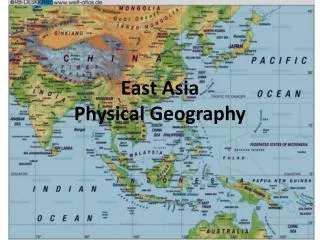
China’s Water Facts • Three ‘bad features’ of the water availability in China: • unevenly distributed, South is rich of water, North is poor Figure: Average annual precipitation in China
China’s Water Facts • Three ‘bad features’ of the water availability in China: • water scarcity of per capita volume, the figure in North China is 1/8 of the national average and 1/25 of the world average.
China’s Water Facts • Three ‘bad features’ of the water availability in China: • serious pollution • Irrigation by using polluted water in North and Northwest China is very common.
China’s Water Facts • Messages from Chinese government… • “all rivers run dry in the North, and all water is polluted in the South” • water consumption per unit of GDP to 125 m3 by 2020, down 60% from nowwith special focus on irrigations, in order to cope with the projected economic growth by 60% by that time. • Jan 2011, the Chinese government announced that it will invest four trillion RMB (US$600 billion) over the next ten years to protect and improve access to water. The major applied instrument is nothing new but massive funding for construction of more water related infrastructure with the latest technology.
Catching up with the ‘North’ Environmental implications of urbanisation and lifestyle change in China: Ecological and Water Footprints” Journal of Cleaner Production17(14), p. 1241-1248
Other possible physical water transfers Can economics help dealing with water scarcity?
International Trade Theories Absolute Advantage: Countries would tend to export products they produced more cheaply than their trading patterns and import goods they produced more expensively. David Ricardo Adam Smith Comparative Advantage: Mutually advantageous trade will always be possible because trade patterns will be based on relative prices rather than absolute prices. The Heckscher-Ohlin Theory A country will tend to export the commodity that uses relatively more of the factor of production which is relatively most abundant in that country. & E. Heckscher Bertil Ohlin
International Trade Theories Leontief Paradox: Leontief calculated the labour and capital content of the exports of the United States to test the HO theory. However, he found a paradox, which is the US was endowed with more capital relative to labour resources but the US export labour intensive products while import capital intensive goods. Wassily Leontief It will be interesting for us to examine whether the interregional trade patterns in China are consistent with the HO factor endowment theory from the perspective of efficiency of water resources distribution and management. Dabo Guan Assessment of regional trade and virtual water flows in China” Ecological Economics, Volume 61, Issue 1, Page 159-170
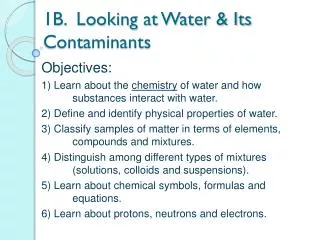
Virtual Water Flows • Virtual Water Flows: water embedded in products and used in the whole production chain, are traded between regions or exported to other countries. • Water footprint is the total virtual water content of products consumed by an individual, business, town, city or country.
Your water footprints = 7,000 liters Spatially Explicit Analysis of Water Footprints in the UK” Water, 3, p 47-63
Virtual water flows accounting model We develop the accounting model based on input-output analysis, which allows us to account for all virtual water throughout the whole supply chain of a product production. Input-Output Structure Monetary Unit: e.g. $ Water Input-Output Structure Monetary + Physical Unit
Virtual freshwater flows • North China – water-scarce region, but exported almost 4,300 million m3 of water, mainly through the trade of water-intensive products. • South China – water-abundant region, but imported water-intensive products such as agricultural products. • In terms of the HO theory, a trade paradox apparently exists from the perspective of natural resources allocation and efficiency.
Virtual water flows in Yellow River basin Assessing regional virtual water flows and water footprints in the Yellow River Basin, China”. Applied Geography . 2011, 34, 691-701
Virtual water flows in Yellow River basin • Overall YRB is net virtual water exporter. • Lower YRB – the most water stress region, exports more water to other two YRB regions than it receives comparatively. • Lower YRB engages less agricultural activities than the other two YRB regions, the exported virtual water are largely driven by food processing, chemicals and other water intensive industry products
Water footprint in Yellow River basin Regional total water footprints of the YRB (million m3) Note: Domestic is the domestic water resources consumed by the local production and consumption activities in each reach. Upper, Middle, Lower and RoC indicate that the total water footprints are contributed from the Upper, Middle, Lower and RoC water resources, respectively. Why is household in there?
Water footprint in Yellow River basin Per capita water footprints per person in the YRB
Water Accounting Hydro-economic Accounting and Analytical Framework Water Availability Water Consumption Return flows Surface, Ground Recycled, Reused Direct Consumption Indirect Consumption Water resources Re-distribution Agriculture, Industry, etc Domestic
Water Accounting (m m) (m n) Economic Sectors Wastewater Flow out Water Supply Sectors Hydro- ecosystem (n m) (n n)
Water Accounting Total Water supplies: 317,800 million m3 Total Wastewater discharge: 81,900 million m3 In terms of a simply mass balance hydrological model, by adopting COD as the indicator: 203,330 million m3of freshwater resource was contaminated by wastewater discharge.
Driving forces of China’s water crisis Here we decompose the total changes (orange line) of freshwater consumption and COD discharge into 5 factors. Δp (blue line): population changes. ΔF (red line) water / pollution efficiency level changes, measured by water/GDP. ΔL (green line): production structure changes. Δys (purple line): consumption pattern changes. Δyv (yellow line): consumption volume changes.
Driving forces of China’s water crisis Economic Sectors Water Supply Sectors Annual freshwater consumption: unit billion m3
Driving forces of China’s water crisis Economic Sectors Wastewater Flow out Annual COD discharge: unit thousand m3
Driving forces of China’s water crisis Wastewater Flow out Hydro- ecosystem Cumulative COD: unit thousand tons
Water Accounting Water Supply Sectors Hydro- ecosystem
Conclusions • Virtual water flows can provide an option for solving the regional water scarcity • In terms of the HO theory, a region/country endowed with rich amount of water resources should export relatively more water-intensive/polluted products • However, we found a paradox in North China and Yellow River Basins with regards to the HO theory. • As there is low cost or even no cost on natural water resources, it may not be applicable to the HO theory. • The virtual water flows should be incorporated in trading decision-making process for water-scarce regions like North China or lower reach of YRB in order to meet present and future consumption and production levels.
Conclusions • Tackling water crisis is a long-term and continuous task… • Investment to improve water service related infrastructure. China has the largest increase of waste water treatment plants over the past years. • In both 2004 and 2010, surveys from Chinese Environmental Protection Ministry, over half of sampled wastewater treatment plants are not either fully or partially in operation. • China needs to build an integrated network to monitor surface and groundwater, and use it to assess and set water policies through an integrated water-resource management system. • The Clean Development Mechanism (CDM) of the Kyoto Protocol lists methane capture at wastewater treatment plants as a viable source of carbon credit.
Thank you! Enjoy your water, but please think differently… about water Dabo Guan: d.guan@leeds.ac.uk