Download
1 / 20
200 likes | 298 Views
Assessing calibration techniques for refining 6-10 day and week +2 850 hPa temperature predictions. Replace V1 reforecast web page with post-processed data from reforecast V2 for improved accuracy. Method involves Gaussian regression analysis and reliability diagrams. Conclusion shows promising results for T850 forecasts.

E N D
NOAA Earth System Research Laboratory Verifying reforecast-calibrated probabilities for 6-10 day and week +2 850 hPa temperatures Tom Hamill NOAA Earth System Research Lab (303) 497-3060; tom.hamill@noaa.gov Also: Gary Bates, Jeff Whitaker, Don Murray
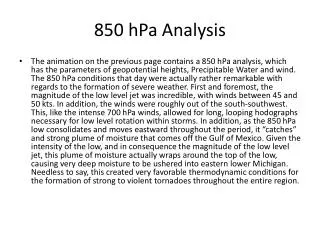
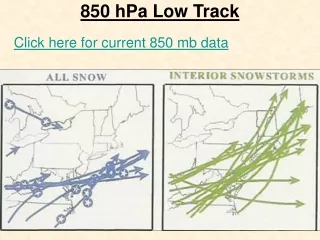
Typical T850 experimental product from ESRL these sorts of products are presumably useful to CPC.
We’d like to replace this web page with one that serves up calibratedforecasts from reforecast v2.How much improvement will we see over the raw GEFS forecasts?
Method for testing calibration withversion 2 reforecasts • Post-processed using the “nonhomogeneous Gaussian regression” of Gneiting et al. (MWR, May 2005). Linear regression approach, but allows the raw ensemble spread to define the amount of spread in the predicted Gaussian forecast distribution. • Reliability diagrams composited over data from Dec 1984 – Dec 2011. • Data is limited to the 1-degree, lat-lon grid that encompasses CONUS. • Cross-validated, with regression model’s training data excluding a given year’s data, e.g., train 2011 based on 1984-2010 data. • Forecast/analysis pairs every third day for the given month and the surrounding two months (x 26 years) used as training data. This means 3x10x26 = 780 training samples typically used. • When evaluating “raw”ensemble in following plots, actually evaluating a Gaussian pdf fit to the sample mean and spread.
Reliability and BSS: lower decile Reliability and BSS
Conclusions • Reforecast-based post-processing of T850 for 6-10 days and week +2 appears to be working satisfactorily. • Once we have surface CFSR data here at ESRL, we’ll repeat for 2-meter temperature. • Intend to replace our reforecast V1 web page in the next month or so with this.