Download
1 / 1
10 likes | 130 Views
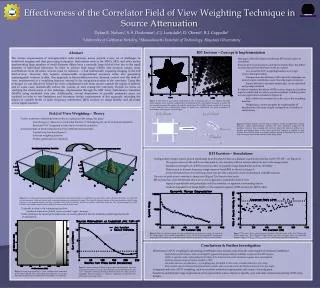
f. f 2. f 1. t 2. t 1. t. Effectiveness of the Correlator Field of View Weighting Technique in Source Attenuation. Dylan R. Nelson 1 , S. S. Doeleman 2 , C.J. Lonsdale 2 , D. Oberoi 2 , R.J. Cappallo 2

E N D
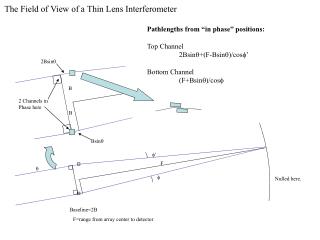
f f2 f1 t2 t1 t Effectiveness of the Correlator Field of View Weighting Technique in Source Attenuation Dylan R. Nelson1, S. S. Doeleman2, C.J. Lonsdale2, D. Oberoi2, R.J. Cappallo2 1University of California Berkeley, 2Massachusetts Institute of Technology, Haystack Observatory Abstract The science requirements of next-generation radio telescope arrays present a new set of challenges to traditional imaging and data processing techniques. Instruments such as the MWA, SKA, and other arrays implementing large numbers of small diameter dishes have a naturally large field-of-view due to the small diameter of individual telescopes. In order to achieve high image fidelity and dynamic ranges, noise contributions from off-center sources must be reduced – a task traditionally requiring imaging of the full field-of-view. However, this requires unreasonable computational resources while also generating unmanageable volumes of data. One approach to this problem involves dynamic control over the field-of-view, implemented as a weighting function internal to the integration routine of the correlator. Using this technique we can effectively reduce the noise contribution levels from sources outside the region of interest, and in some cases dramatically reduce the volume of data exiting the correlator. Herein we focus on verifying the effectiveness of this technique, implemented through the MIT Array Performance Simulator (MAPS) using simulated data sets. Additionally, several dimensions of possible parameter space are explored in order to test limitations and determine design requirements of this approach, including the impact of variable levels of radio frequency interference (RFI) excision on image fidelity and off-center source signal rejection. RFI Excision – Concept & Implementation • Data gaps in the (t,f) domain result from RFI excision prior to correlation • Excision in the (t,f) domain is uniform for all baselines, but differs on a baseline per baseline basis in the (u,v) plane • As a result the FOV weighting function is no longer uniform among baselines • Compromises the efficiency with which the technique can restrict source contribution away from the region of interest • Impact difficult to calculate analytically, can be simulated and perhaps modeled • In order to simulate the effects of RFI excision, larger (u,v) patches must be subdivided in order to produce multiple visibility points, as in next-generation correlators (Figure 4) • Each subdivision corresponds to the size of the weighting function • Weighting u,v points properly by requiring that all baselines have the same weight, independent of number of subdivisions Figure 4. The effect of (u,v) patch subdivision on the uv-coverage plot of a 21 element VLA-like interferometric array antenna configuration. Subdividing to fit a convolution function of radius 800 wavelengths increases the number of visibility points from 210 to 14210, shown on the left. A zoomed in view indicates how progressively larger uv patches are subdivided into greater numbers of convolution sized regions, as on the right. Field of View Weighting – Theory (f,t) Plane (u,v) Plane • Fourier transform relationship between the (u,v) plane and the image/sky plane • Convolving (u,v) plane by a windowing function Multiplying the sky by its Fourier transform • Restricted FOV is imposed on data before it exits the correlator • Various families of windowing functions have different characteristics: • Top-hat/step function (Figure 1) • Gaussian weighting function • Prolate spheriodal wave functions v Figure 5. Relation between the (t,f) and (u,v) planes. In this example three excised frequency ranges (narrow-band) represent the same frequency ranges for all baselines, however once mapped into the (u,v) plane the data loss differs on a baseline per baseline basis. If the same convolution function is applied to each baseline, the resultant shape is no longer uniform among all baselines, and we effect only an averaged convolution function in the image plane. 1st Baseline 2nd Baseline u RFI Excision – Simulations • Configuration of eight sources placed equidistant from the phase center, at a distance equal to the first Jinc null (~157.165”, see Figure 2) • We expect sources in the null to be attenuated to zero intensity with no adverse effects on rms at the image center • Simulated varying levels of RFI excision in order to quantify image degradation and loss of fidelity • Data excised in discrete frequency ranges (narrow-band RFI) as shown in Figure 5 • Source deviation from zero and map center rms provide a measure of errors introduced with RFI excision • The ratio of peak source intensity to image rms (Figure 7) is linear to first order • RFI excision has clear detrimental effects on source suppression outside the field of view • Impact is quantifiable and potentially could be modeled, no apparent confounding factors • Gradual degradation of image fidelity in the expected regimes of RFI excision for MWA, SKA Figure 1. Two-dimensional representations of the top-hat convolution function, as applied in the (u,v) plane, and its Fourier transform, an Airy Disk (or Jinc function). Both are shown with a maximum intensity normalized to unity. Note that the discrete nature of the step function, which is also present in our implementation and any correlator with finite resolution, effectively restricts achievable precision. The corresponding Airy Disk exhibits rapid falloff coupled with extended structure at all distance scales. • Tradeoffs in choice of a windowing function: -Amplitude attenuation (falloff) versus extended “ripple” structure • Verify technique by insuring that intensities of sources placed at known locations exhibit expected levels of attenuation: Figure 6. Effective dynamic range of a sky configuration consisting of a single 1 Jy source at the image center, shown with a logarithmic y-axis. The trend in degradation of dynamic range with RFI excision, for a relatively fixed total flux in the field of view, is clearly visible. Figure 7. The ratio of the source intensity located at the null point of the Airy Disk to the center image rms. The “Expected Ratio Limit” provides an upper limit on achievable dynamic range of ≈ Nstations/√Nsources ≈ 21/√8 ≈ 7.4 for our particular configuration. Conclusions & Further Investigation • Effectiveness of FOV weighting in attenuating contribution from sources away from the center region of interest is established • Degradation in performance with increasing RFI appears both gradual and quantifiable in expected low-RFI regimes • Ability to operate under confounding factors likely to be found in real-world situations requires more investigation: • Limits to dynamic range of baseline lengths (~100?) • Allowable tolerance in calibration – uv weighting may be limited to time scales of stable calibration of an array • More realistic skies for future testing (benchmark realistic skies or actual source distributions derived from sky maps) • Computational costs of FOV weighting, such as correlator resolution requirements, still a topic of investigation • Sensitivity and dynamic range requirements of next-generation science objectives feasible even with data volume issues facing LNSD array designs Figure 3. Source intensity plotted versus expected attenuation. Intensity is plotted four times for each radial distance, corresponding to the four “arm” directions, although deviation between these four data points is negligible. The Jinc function is scaled in amplitude to represent zero attenuation at the map center. Figure 2. Image map showing a “plus” configuration simulation of 25 sources placed 37.5” apart, each with intensity 1 Jy. A top-hat windowing function of radius 800 wavelengths was enforced.