Download
1 / 45
450 likes | 568 Views
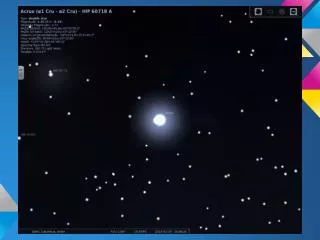
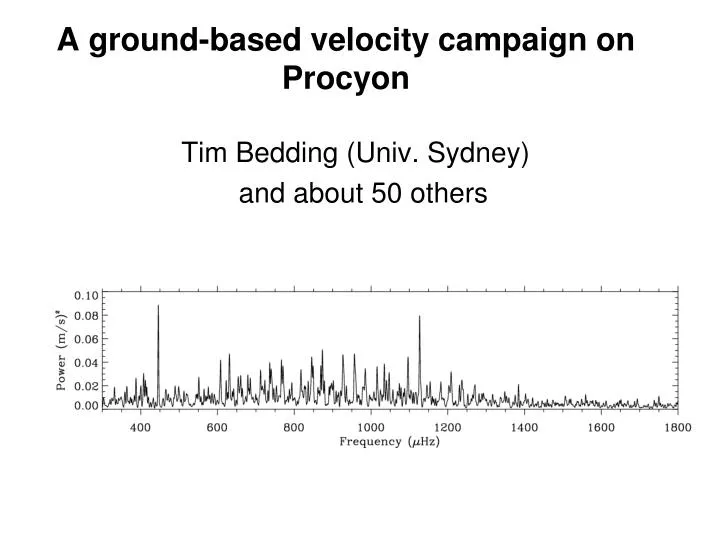
A ground-based velocity campaign on Procyon. Tim Bedding (Univ. Sydney) and about 50 others. Procyon A. angular diameter = 5.40±0.03 mas (1%; VLTI) parallax = 285.9 ± 0.9 mas (0.5%; Hipparcos) radius = 2.04±0.02 (1%) mass = 1.46±0.03 (2%; binary orbit). Brown et al. (1991).

E N D
A ground-based velocity campaign on Procyon Tim Bedding (Univ. Sydney) and about 50 others
Procyon A • angular diameter = 5.40±0.03 mas (1%; VLTI) • parallax = 285.9 ± 0.9 mas (0.5%; Hipparcos) • radius = 2.04±0.02 (1%) • mass = 1.46±0.03 (2%; binary orbit)
Brown et al. (1991) Previous velocity observations Martic et al. (2004) Fourier power spectra of Doppler measurements. All have power centred at about 1 mHz (15-20 minutes) Eggenberger et al. (2005) Leccio et al. (2006) 0 1 2 3 Frequency (millihertz)
p-mode oscillations are standing sound waves n =1 n =2 n =3 frequencies tell us about internal sound speed
Fourier power spectrum of solar velocities: n increases → Power
ℓ > 0 (non-radial) ℓ=1 ℓ= 2 ℓ= 3
Fourier power spectrum of solar velocities: n increases → Power
Dn = 135 mHz ℓ=1 n increases → ℓ=0 ℓ=1 ℓ=0 ℓ=1 ℓ=2 2 0 ℓ=2 ℓ=3 ℓ=3 3
Brown et al. (1991) Previous velocity observations Martic et al. (2004) Fourier power spectra of Doppler measurements. All have power centred at about 1 mHz (15-20 minutes) Eggenberger et al. (2005) Dn ≈ 55mHz Leccio et al. (2006) 0 1 2 3 Frequency (millihertz)
What we knew in 2007 there is a power excess in velocity amplitude is lower than predicted theoretically agreement on Dn ≈ 55mHz. no agreement on frequencies, presumaby due to daily aliases/mixed modes/short mode lifetime?
The Velocity Campaign Arentoft et al. (2008, ApJ)
11 telescopes at 8 observatories over 25 days 10 days HARPS CORALIE McDonald Lick UCLES Okayama Tautenburg SOPHIE EMILIE SARG FIES
HARPS SOPHIE SARG
What is an echelle diagram? Here is the solar power spectrum divided into segments of width Dn. Dn= 135 mHz ℓ=1 ℓ=0 ℓ=1 ℓ=0 ℓ=1 ℓ=2 2 0 ℓ=2 ℓ=3 ℓ=3 3
échelle diagram l=2 l=0 l=2 l=0 l=1 l=3 Dn dn02 dn13 BISON freq. Frequency mod Dn
Noise-optimized Sidelobe-optimized
which ridge is which? l=2 l=0 l=1 l=3
Do we have the correct ridge identification? l=2,0 l=3,1
Ridge structure: YES! l=2,0 l=3,1
Absolute model frequencuies: NO! l=1 l=2,0 model (Christensen-Dalsgaard)
A new method: scaled echelle diagrams Bedding & Kjeldsen (2010, Comm. Asteroseismology)
greyscale = a Cen A Δ = Sun 0.78
YES! greyscale = Procyon ○=HD 49933 x 0.657 (Benomar et al. 2010) ●=HD 49385 x 0.993 (Deheuvels et al. 2010) l=2,0 l=1
Asteroseismology using ridge spacings 500 mHz acoustic glitch at t=1000s (He ionization zone)
Avoided crossings in subgiants l=2,0 l=3, 1 model with 1.6Msun and Z=3% (Christensen-Dalsgaard 2004)
“C-D diagram” Christensen-Dalsgaard (1988,2004) “p-g diagram” Bedding et al. (in prep.)
Procyon: mass = 1.46±0.03 (2%; binary orbit) Bedding et al. (in prep.)
Lessons for SONG combining data from multiple sites works well (adjust weights to optimize noise and sidelobes) cannot afford to take 2-3 years to analyse each star! low stellar background in velocity allows detection of wider range of frequencies than may be possible with Kepler. In Procyon, broad envelope allowed us to measure He ionization glitch Kepler may not give many sun-like stars (18 Sco) or lower-mass stars (a Cen B, tau Cet) SONG will observe nearby stars with good parameters let’s SING!