Download
1 / 6
60 likes | 176 Views
Understand the challenges in using probabilistic tools for climate change projections, addressing correlated variables, and presenting meaningful information. Explore how uncertainties are considered in predicting outcomes for SE Australian wheat crop failure rates. Discuss the effectiveness of probabilistic tools amid high climate change uncertainty.

E N D
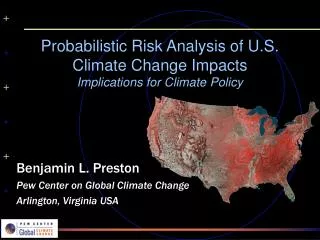
Probabilistic use of climate change projections Chris Bretherton Department of Atmospheric Science University of Washington
Luo et al. 2005 Climate Research reading • Decisionmakers in many fields are trying to assess their vulnerability to climate change and what type of adaptation strategies may be needed. • Given emissions/physical modeling uncertainty, it is logical to use probabilistic tools. • However, this has challenges • Lack of standard pdfs for global GHG forcings • Uncertainty of climate sensitivity of models • Regional rainfall change more uncertain than temperature change. • Uncertain response of system of interest to climate change • How to present the information meaningfully • Luo et al. is an example of tackling these challenges.
One challenge: Correlated variables • Markoff and Cullen (2006, Clim Res) PNW
Question: How frequently will SE Australian wheat crop fail to be profitable? • Uncertainties considered and disaggregated: pCO2: 530-786 ppm Climate sens: 0.33-0.57 K/(W m-2) Tloc/Tglob: 0.77-1.08 Rainfall (GS): -7%-3% per 1K global DT (NGS):-7%-11% • Uniform pdfs assumed based on extrema of the available 9 models run on 6 SRES scenarios [Is this a good idea?] • Correlations between uncertainties neglected. • APSIM wheat model assumed (no uncertainty there!)
Presentation of results • Current predicted crop failure rate: 27% • Expected 2080 failure rate: 45% (change based on DT, uncertainty based on rainfall change). [Another wheat model gives the opposite result!]
For discussion • When should we aggregate socioeconomic uncertainty (theoretically under human control) with physical model uncertainty? • Are probabilistic tools effective given the large level of uncertainty we have about climate change? • How should we construct pdfs from model outputs • ‘Surprise’ • weight all models equally? • scenario weighting?