Download
1 / 46
460 likes | 553 Views
Explore climate model outputs' impacts on water availability and allocation decisions for Florida's largest water supplier. Emphasizing dynamical and statistical downscaling methods, hydrologic simulations, and integrated models.

E N D
Use of Climate Projections for Water Supply Planning Alison Adams, Ph.D., P.E. NCPP Workshop August 12-16, 2013
It takes a team FSU/COAPS VasuMisra Lydia Stefanova www.coaps.fsu.edu UF/WATER INSTITUTE Wendy Graham Syewoon Hwang www.waterinstitute.uf.edu TAMPA BAY WATER Alison Adams TirusewAsefa Jeff Geurink www.tampabaywater.org www.floridawca.org www.floridaclimateinstitute.org
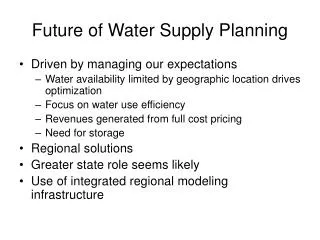
Florida’s Largest Regional Public Water Supplier Wholesale drinking water to six governments 2.4 Million Residents 220-250 mgd annual average Seasonal to multi-year variable climate
Tampa Bay Water’s Climate Change Assessment Project …. In this project we are using dynamically and statistically downscaled climate model output to drive hydrologic models and explore potential impacts of climate variability and climate change on water availability and water allocation decisions
Water Institute Research Raw GCMs or Reanalysis GCMs_retro. Reanalysis GCMs_future Observation R1, R2, ERA40, 20CR CMIP3: CCSM, GFDL, HadCM3, etc. Bias-corrected GCMs Downscaling Observation Statistical method; BCSD, SDBC, BCCA, BCSA, etc. Dynamical downscaling MM5, RSM, etc. Downscaled GCM Bias-correction Application for Tampa Bay region Hydrologic model (IHM)
What we have done so far • Statistical downscaling • Comparative evaluation of 4 methods (BCSD_daily, BCCA, SDBC, BCSA) • Hwang and Graham (2013) Hydro. Earth Syst. Sci • Hydrologic simulation • Submitting to ASABE transaction • Evaluation of downscaled reanalysis data • R1+MM5 (Hwang et al., 2011) • R2+RSM (Stefanova et al., 2011) • ERA40+RSM (Stefanova et al., 2011) • 20CR+RSM (DiNapoli and Misra, 2012) • Hwang et al 2013 Reg. Environ Change
What we have done so far • Uncertainty of Bias-correction in climate change impact assessment • Evaluated Future Projections through hydrologic model
Spatial variability (Variograms)
Data http://coaps.fsu.edu/CLARReS10/index.shtml • 3 GCMs + Regional Spectral Model (RSM), CCSM, HadCM3, and GFDL • Spatial resolution (10kmx10km) over southeastern US • Variables: hourly Prec., humidity, wind speed, etc., daily Tmax/min data • Daily bias-corrected Prec. data are available • Retrospective simulation period: 1969-1999 • Future simulation (AR4 A2 scenario): 2039-2069
Integrated Hydrologic Model • TBW and SWFWMD commissioned the development and application of an integrated surface water/groundwater model for the Tampa Bay Region. • The Integrated Hydrologic Model (IHM) was developed which integrates the EPA Hydrologic Simulation Program-Fortran for surface-water modeling with the US Geological Survey MODFLOW96 for groundwater modeling. Ross et al., 2004 (IHM theory manual)
Dynamical Downscaling • Assessment of the utility of dynamically-downscaled regional reanalysis data to predict streamflow in west central Florida • Reanalysis data – robust proxy of historic atmospheric observations • Verifying accurate prediction of historic climatic and hydrologic behavior using reanalysis data is an essential first step before using retrospective and future GCM projections to predict potential hydrologic impacts of future climate change • Assessment of dynamically downscaled GCM future projections
Wet season Dry season Bias-corrected reanalysis data for hydrologic model • Study period from 1989 to 2001 • R1+MM5 (Hwang et al., 2011) 1986-2008 • R2+RSM (Stefanova et al., 2011) 1979-2001 • ERA40+RSM (Stefanova et al., 2011) 1979-2001 • 20CR+RSM (DiNapoli and Misra, 2012) 1903-2008 IHM calibration/verification period 1989-2006
Comparison of the mean annual cycles of (a) monthly mean and (b) standard deviation of daily precipitation. Raw results monthly mean precipitation standard deviation of daily precipitation
Comparison of time series of (a) annual total precipitation and (b) standard deviation of daily precipitation over the year Raw results Bias-corrected results
Comparison of error statistics of monthly areal precipitation predictions Raw Raw Bias-corrected Bias-corrected
Comparison of observed vs. simulated mean monthly streamflow Bias-corrected results Raw results
Comparison of observed vs. simulated annual time series Bias-corrected results Raw results
Comparison of error statistics of monthly streamflow simulations for each target station;(a) PBIAS, (b) RSR, (c) R2, and (d) NSE
Bias corrected reanalysis data for hydrologic model results • Bias correction removed all errors in mean daily, monthly and annual ppt • Errors in daily stddev were removed but not for monthly and annual totals • Raw reanalysis data has errors in time series of daily rainfall were not corrected and these errors were aggregrated into monthly and annual timeseries • Daily ppt timing errors propagated and were enhanced by the non-linear streamflow processes in IHM • All reanalysis data underestimated streamflow • In the unconfined aquifer region, rainfall errors lead to underpredicting groundwater levels.
Results of bias corrected reanalysis data for hydrologic model • Ppt errors propagated and enhanced by the non-linear hydrologic processes produced low hydrologic model skill and can have significance water supply planning implications • Need to reproduce more detailed ppt characteristics than daily rainfall to accurately capture hydrologic behaviors for water supply planning • Conclusion: Using daily CDF mapping for bias correction is not sufficient for predicting hydrologic behavior. Improvements in RCM physics and parameterization or development of more enhanced bias correction techniques
CLAREnCE10 data http://coaps.fsu.edu/CLARReS10/index.shtml • 3 GCMs + Regional Spectral Model (RSM) • CCSM, HadCM3, and GFDL (not available yet) • Spatial resolution (10kmx10km) over southeastern US • Variables • hourly Prec., humidity, wind speed, roughness, etc. • daily Tmax/min data • Daily bias-corrected Prec. data are available • Retrospective simulation period • 1968-2000 • Future simulation (AR4 A2 scenario) • 2038-2070
Bias-correction (BC) Methodology • 4 Future Bias Correction methods • Correct using historic bias amount corresponding the ‘magnitude’ of future prediction (CDFm, Wood et al) • Correct using historic bias amount corresponding the ‘Percentile’ of future prediction (EDCDFm, Li et al., 2010) • Correct using historic bias percentage corresponding the ‘magnitude’ of future prediction (CDFm_%bias) • Correct using historic bias percentage corresponding the ‘Percentile’ of future prediction (EDCDFm_%bias) • 3 methods for CDF development • Monthly CDF (30data) • CDF for moving window ( 30 days, 61data) • CDF for moving window ( 15 days, 31data) Total 12 combination of methodologies!
Bias-correction (BC) Methodology • Future Bias Correction methods: CDF mapping Example 1 Sim_future Sim_retro. BC_retro BC-Sim_future + CDF: 1 raw1 Bias-corrected Sim_future obs • 3 different CDFs • Monthly CDF (30 data/yr) • CDF for moving window (15 days, 31 data/yr) • CDF for moving window (30 days, 61 data/yr) raw 2 Precipitation
1. Mean daily precipitation HadCM3+RSM Raw results Bias-corrected results
1. Mean daily precipitation CCSM+RSM Raw results Bias-corrected results 1 CDFm 2 EDCDFm 4 EDCDFm_%bias 3 CDFm_%bias
2. Std. of daily precipitation Raw results HadCM3+RSM Bias-corrected results 1 CDFm 2 EDCDFm 4 EDCDFm_%bias 3 CDFm_%bias
2. Std. of daily precipitation CCSM+RSM Raw results Bias-corrected results 1 CDFm 2 EDCDFm 4 EDCDFm_%bias 3 CDFm_%bias
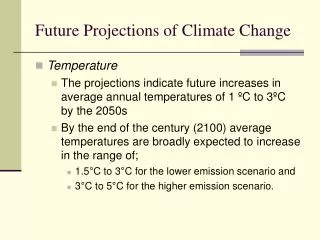
I. Temperature • Spatial distribution of mean temperature (map comparison) • Annual cycle of • Monthly mean Tmax and Tmin • Differences between the simulations for 1969~1999 & 2039~2069
1969~1999 2039~2069 Approx. +2`C = Tminspatial distribution CCSM Observation 18.5˚C Approx. +2`C = HadCM3 14.5˚C Approx. +2`C = GFDL
1969~1999 2039~2069 Approx. +3`C = Tmaxspatial distribution CCSM Observation 30 ˚C Approx. +3`C = HadCM3 27˚C Approx. +2`C = GFDL
1.1 Mean daily Tmax& Tmin Raw results Tmax Tmax Tmax Tmin Tmin Tmin Bias-corrected results Tmax Tmax Tmax Tmin Tmin Tmin
1.2 Mean temperature change: 2039~2069 – 1969~1999 Bias-corrected results Raw results Tmax Tmin
II. Precipitation • Spatial distribution of mean precipitation (map comparison) • Annual cycle of • Monthly mean precipitiation • Differences between the simulations for 1969~1999 & 2039~2069
1969~1999 2039~2069 2.1 Raw Precipitation results 1.8mm Even lower Way off!! underestimated CCSM Observation 3.9mm 0.8mm 3.3mm HadCM3 • Raw CCSM results significantly underestimate the mean precp. by 2.5mm over the region • Raw HadCM3 and GFDL results overestimate by 1~2mm • Based on the future scenario, precipitation may decrease or increase GFDL
2.2 Mean daily precipitation Raw results Bias-corrected results
2.3 Mean precipitation change: 2039~2069 – 1969~1999 Raw results Bias-corrected results
III. Hydrologic implications • Annual ET, ET fraction (ET/Precip.) • Mean streamflow • Design flow estimations
3.1 ET estimations Annual average ET (mm/year) ET fraction (ET/Precp.) CCSM CCSM HadCM3 HadCM3 GFDL GFDL
3.2 mean streamflow (Alafia River station) Future simulations Streamflow Change (Future-retro.) CCSM Retrospective simulation results HadCM3 BC1: bias-correction using monthly CDF BC5: bias-correction using 15 CDF BC9: bias-correction using 30 CDF GFDL
3.2 mean streamflow (Alafia River station) Streamflow Change (Future-retro.) Precipitation Change (Future-retro.)
3.3 Std. of streamflow (Alafia River station) Future simulations Streamflow Change (Future-retro.) Retrospective simulation results BC1: bias-correction using monthly CDF BC5: bias-correction using 15 CDF BC9: bias-correction using 30 CDF
3.3 Design flow estimation 7Q10high flow 7Qxxhigh (low) flow means the average maximum (minimum) flow for seven consecutive days that has probable recurrence interval of once in xx years, respectively. 7Q2low flow CCSM CCSM GFDL HadCM3 GFDL HadCM3
Conclusions Used 3 dynamically downscaled GCMs (i.e., CCSM, Had3CM, GFDL), 3 CDF construction strategies for CDF mapping bias-correction, and monthlydelta method for future scenarios • Differences among GCM projections overwhelmed differences among bias correction techniques. • Temperature Results • All GCMs successfully reproduced spatial distribution and mean climatology of retrospective daily temperature • All consistently estimated 2-3oC increase of mean temperature for future (2039~2069) under future A2 scenario. • Precipitation Results • Dynamically downscaled retrospective CCSM predictions are way off! • Retrospective HadCM3 and GFDL reproduce seasonal cycle of precipitation.(e.g., wet summer) • Different GCMs produced conflicting precipitation change estimates for future A2 scenarios (some higher, some lower)
Conclusions continued • Hydrologic implications • Even with consistent increased temperature estimates, differences among future precipitation estimates propagate into significant differences in future hydrologic predictions ( i.e. ET, mean streamflow predictions, and 7Q10 estimates). • Precipitation signal overwhelms temperature signal in predicting hydrologic implications of projected future changes. Q. How many GCMs are required to get an accurate representation of range of possible future precipitation projections and thus range of possible hydrologic change? Q. Should we continue to use CCSM in our analysis?
Possible Future Work • Consider other climate model products & GHG scenarios… • NARCCAP, CMIP5, COAPS products, etc.? • Other methodologies to downscale/bias-correct climate model results? • Statistical downscaling methods in order to increase number of GCMs considered?