Download
1 / 16
170 likes | 369 Views
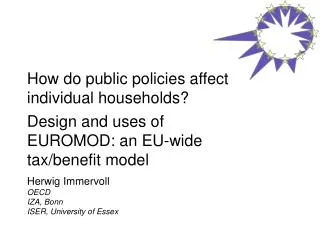
How do public policies affect individual households? Design and uses of EUROMOD: an EU-wide tax/benefit model. Herwig Immervoll OECD IZA, Bonn ISER, University of Essex. Background & acknowledgements.

E N D
How do public policies affect individual households?Design and uses of EUROMOD: an EU-wide tax/benefit model Herwig Immervoll OECD IZA, Bonn ISER, University of Essex
Background & acknowledgements • EUROMOD: Consortium of academics and government researchers in most EU Member States: currently around 20 institutions; 50+ researchers • Model building based on a number of EU-funded research projects, starting in mid-1990’s • Co-ordinated by Holly Sutherland(ISER, University of Essex) • Model applications at national and international level, including for OECD
Outline • Tax-benefit models • What is EUROMOD? • Benefits: Illustration of uses • The EUROMOD database • Data access: experience and status quo • Data access: the future
Tax-benefit models • Calculate cash benefits and taxes and contributions for a (large) sample of households, representative of the population • Focus on policies that can be straightforwardly assigned a monetary value. • The main output from the model is household income. • Representative and results for: • aggregates (budgetary effects) • distributions (poverty and inequality indicators) • individual families (real and hypothetical) • indicators of incentives (e.g. net replacement rates) • and changesin these for alternative scenarios
EUROMOD - what is it for? • EU-15, currently being extended to New Member States • Built with comparabilityas the main objective • Cross-country comparisons • analysis of existing policies • “policy swapping” • Common reforms or reforms with common objectives • National reforms with an EU perspective • National analysis for countries without national models • “What if” questions about • existing policy instruments and sub-components • changes and reforms (actual, proposed, hypothetical scenarios)
EUROMOD - an integrated model • Original incomes (mainly market income) taken from micro-data. • Tax liabilities and benefit entitlements are simulated using detailed policy rules of a particular year • … and re-simulated for each new scenario • Aim is to replicate individual tax liabilities and benefit entitlements that tax authorities and benefit agencies would determine. • Requires detailed information about market incomes, family circumstances and labour market status for each individual. • good-quality micro-data is essential.
Uses of EUROMOD:Examples of recent work • Redistribution of existing tax and transfer policies in EU-15 • Evaluating alternative policy scenarios: How can more generous transfers help to reduce child poverty? How much does it cost? • Work incentives: What part of family income is maintained when becoming unemployed?
1. Equalising effect of tax-benefit systems (% change in Gini coefficient) Source: EUROMOD (Immervoll et al., 2006) Countries are ranked in descending order of inequality
1. (continued)Equalising effect of different policies Source: EUROMOD (Immervoll et al., 2006) Countries are ranked in descending order of inequality
2. The spending - child poverty trade-offEffects of increasing payments per child Source: EUROMODWork in progress: Levy, Lietz, Sutherland
3. Work incentives:Distribution of Net Replacement Rates Source: EUROMOD (Immervoll, O’Donoghue, 2003)
The EUROMOD database • Representative household micro-data for each country • Fully documented and transparentdata sources; sampling; non-response • Partly harmonised to ensure comparability:variable names & definitions EUROMOD “core variables” for all countries • But different sources and levels of detail “best available” data in each country
Data access • Separate agreements with each data provider; different access conditions • Conditions for accessing full database: go by most restrictive agreement • Selective use of particular data sets possible • Users need to have or obtain access permissions individually from each original data provider • Or as part of a project consortium(e.g. EU-financed FP5 project “MICRESA”: Micro-level Analysis of the European Social Agenda)
Data access: future perspectives • Long-term access negotiated on behalf of all users • Secure remote access:promote access and ensure compliance • Benefit from experience of existing facilities (UKDA, LIS, DIW) • Customisable: Scope of RA would reflect access conditions stipulated by each data provider • EU SILC in addition to national databases+ many users will have existing access permission+ one set of access conditions for all countries
EUROMOD:information, statistics, results • www.iser.essex.ac.uk/msu/emod/ • herwig.immervoll@oecd.org • receive email news about EUROMOD:hollys@essex.ac.uk