Download
1 / 30
300 likes | 317 Views
This article provides a step-by-step guide on how to critique visualizations, considering factors such as design, insight, success, and visual transformation. It also includes examples and general guidelines for creating effective visualizations.

E N D
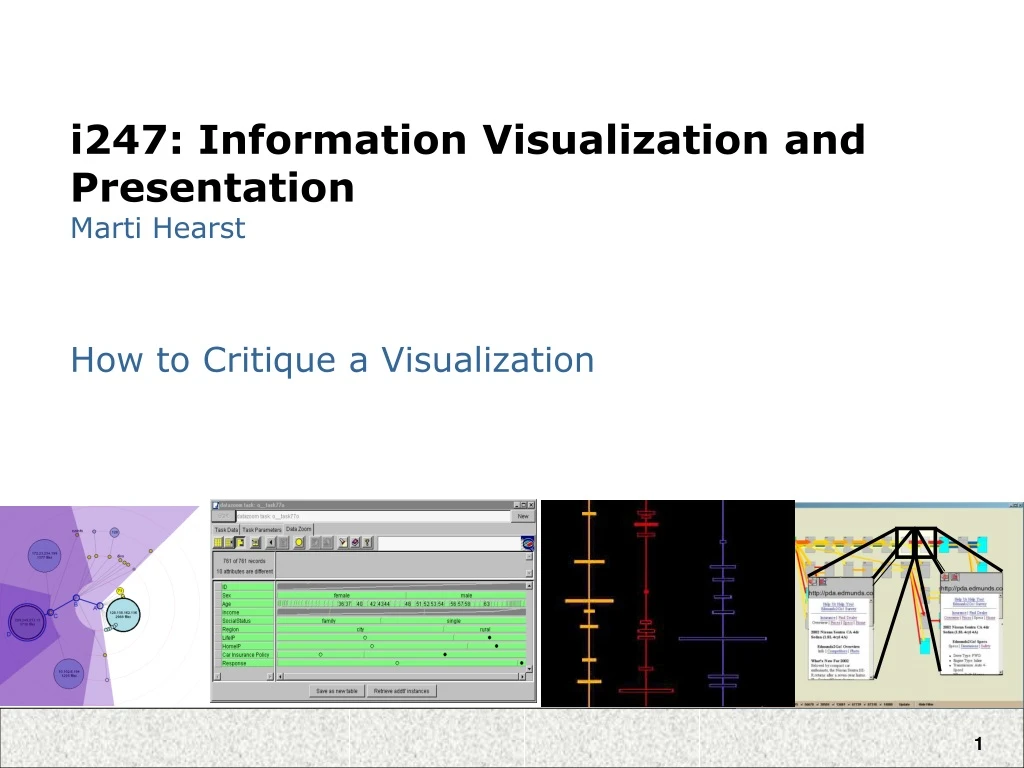
i247: Information Visualization and PresentationMarti Hearst How to Critique a Visualization
How to Critique a Visualization What are your ideas?
Critiquing a Visualization • First, consider the purpose of the visualization and who the intended audience is. • Then, ascertain your initial reaction. • Then, examine the visualization in detail. • Then, answer questions like the following.
Over-Arching Questions • Is the design visually appealing/aesthetically pleasing? • Is it immediately understandable? If not, is it understandable after a short period of study? • Does it provide insight or understanding that was not obtainable with the original representation (text, table, etc)? • Does it provide insight or understanding better than some alternative visualization would? What kind of visualization might have been better?
How Successful is the Visualization? • Does the visualization reveal trends, patterns, gaps, and/or outliers? • Does the visualization successfully highlight important information, while providing context for that information? • Does it distort the information? If it transforms it in some way, is this misleading or helpfully simplifying? • Does it omit important information?
Questions about the Visual Transformation • Does it use visual components properly? • That is, does it properly represent the data using lines, color, position, etc? • Does it transform nominal, interval, and quantitative information properly? • Does it use labels and legends appropriately?
Example: news.com’s “What’s Hot” • “What's Hot gives a visual snapshot of which stories are most important on CNET news.com right now. What's Hot is updated every time a story is published, or at least once an hour.” • What makes a story hot? • The story is new. Any story published in the last 72 hours is eligible. • The story is widely-read. The more individuals who read the story, the hotter it is. Data is updated hourly, or when new stories are published. http://www.news.com/Hot/2030-12_3-5843382.html
Few on “Eloquence Through Simplicity” • Well-designed dashboard are: • Well-organized • Condensed • Summaries and exceptions • Concise, communicate the data and its message in the clearest and most direct way possible. • Can be assimilated quickly • Provide a broad, high-level overview • Address specific information needs
More General Guidelines • Simplify, simplify, simplify! • Must be the best way to show this data.
Data-to-Pixel Ratios • Examples of wasteful pixels: • Decorative graphics • Meaningless variations in color • Borders to separate when white space will suffice • Distracting backgrounds and fill colors • Unnecessary grid lines in tables and graphs • 3D when not needed (nearly always not needed) • Ornate/physical looking widgets
Data-to-Pixel Ratios • How to make non-data pixels work well: • Use light, low-saturated colors • Hard to see when printed though! • Regularize the appearance of non-data visual elements.
Distinguishing Important Information • Static vs. Dynamic Information • Make use of location on screen • All quadrants are not created equal. • Don’t highlight too much!
Critique Practice(From Few, chapter 8) • Goal: make a dashboard for someone monitoring sales. • Must show: • Sales revenue • Sales revenue in the pipeline (expected revenue divided into categories of probability) • Profit • Customer satisfaction ratings • Top 10 customers • Market share compared to other companies.
Design Decisions • What to summarize, and how? • Which units of measurement to use? • What information will be helpful as context? • What measures to compare against? • Which visual components are most effective?
Next Week • More Tufte • Start on Interactive Visualization