i247: Information Visualization and Presentation Marti Hearst
740 likes | 932 Views
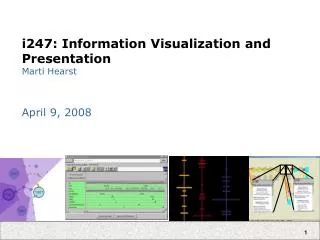
i247: Information Visualization and Presentation Marti Hearst. April 9, 2008. Search and Text Visualization. Nominal data is hard to visualize Goals of search vs. text analysis Only a tiny fraction of those people who want to use search want to analyze text.

i247: Information Visualization and Presentation Marti Hearst
E N D
Presentation Transcript
i247: Information Visualization and PresentationMarti Hearst April 9, 2008
Search and Text Visualization • Nominal data is hard to visualize • Goals of search vs. text analysis • Only a tiny fraction of those people who want to use search want to analyze text. • For those analysts, there are many interesting ideas available. • Today: • Viz for text mining and sense making • Viz for text concordances • What’s up with Tag Clouds?
Text Mining Support • TAKMI, by Nasukawa and Nagano, ‘01 • The system integrates: • Analysis tasks (customer service help) • Content analysis • Information Visualization
Text MiningTAKMI, by Nasukawa and Nagano, 2001 • Documents containing “windows 98”
TAKMI, by Nasukawa and Nagano, 2001 • Patent documents containing “inkjet”, organized by entity and year TAKMI, by Nasukawa and Nagano, 2001
Visualization Support for SenseMaking • DLITE by Cousins et al. ‘97
Visualization in Sensemaking TRIST (The Rapid Information Scanning Tool) is the work space for Information Retrieval and Information Triage. TRIST, Jonkers et al 05 User Defined andAutomatic Categorization Comparative Analysisof Answers and Content Rapid Scanningwith Context Launch Queries Entities Query History Dimensions AnnotatedDocument Browser Linked Multi-Dimensional Views Speed Scanning
Visualization for Sensemaking Sandbox, Wright et al ‘06 Quick Emphasis of Items of Importance. DynamicAnalytical Models. Direct interactionwith Gestures(no dialog, no controls). Assertions with Proving/Disproving Gates.
Concordances & Word Frequencies From www.concordancesoftware.co.uk
Concordances & Word Frequencies SeeSoft by Eick et al.
Concordances & Word Frequencies TextArc by Paley.
Concordances & Word Frequencies WordTree by Wattenberg
Concordances & Word Frequencies Bubble Charts (implemented by Wattenberg)
Social Tagging • Metadata assignment without all the bother • Spontaneous, easy, and tends towards single terms • Usually used in the context of social media
The Tagging Opportunity • At last! Content-oriented metadata in the large! • Attempts at metadata standardization always end up with something like the Dublin Core • author, date, publisher, … yaaawwwwnnn. • I’ve always thought the action was in the subject metadata, and have focused on how to navigate collections given such data.
The Tagging Opportunity • Tags are inherently faceted ! • It is assumed that multiple labels will be assigned to each item • Rather than placing them into a folder • Rather than placing them into a hierarchy • Concepts are assigned from many different content categories • Helps alleviate the metadata wars: • Allows for both splitters and lumpers • Is this a bird or a robin • Doesn’t matter, you can do both! • Allows for differing organizational views • Does NASCAR go under sports or entertainment? • Doesn’t matter, you can do both!
Tagging Problems • Tags aren’t organized • Thorough coverage isn’t controlled for • The haphazard assignments lead to problems with • Synonymy • Homonymy • See how this author attempts to compensate:
Tagging Problems / Opportunities • Some tags are fleeting in meaning or too personal • toread todo • Tags are not “professional” • (I personally don’t think this matters)
Investigating social tagging and folksonomy in the art museumwith steve.museum", J. Trant, B. Wyman, WWW 2006 Collaborative Tagging Workshop
What about Browsing? • I think tags need some organization • Currently most tags are used as a direct index into items • Click on tag, see items assigned to it, end of story • Co-occurring tags are not shown • Grouping into small hierarchies is not usually done • del.icio.us now has bundles, but navigation isn’t good • IBM’s dogear and RawSugar come the closest • I think the solution is to organize tags into faceted hierarchies and do browsing in the standard way
Definition Tag Cloud: A visual representation of social tags, organized into paragraph-style layout, usually in alphabetical order, where the relative size and weight of the font for each tag corresponds to the relative frequency of its use.
Definition Tag Cloud: A visual representation of social tags, organized into paragraph-style layout, usually in alphabeticalorder, where the relative size and weightofthefont for each tag correspondsto the relative frequency of its use.
I was puzzled by the questions: • What are designers and authors’ intentions in creating or using tag clouds? • How do they expect their readers to use them?
On the positive side: • Compact • Draws the eye towards the most frequent (important?) tags • You get three dimensions simultaneously! • alphabetical order • size indicating importance • the tags themselves
Weirdnesses • Initial encounters unencouraging • Some reports from industry: • Is the computer broken? • Is this a ransom note?
Weirdnesses • Violates principles of perceptual design • Longer words grab more attention than shorter • Length of tag is conflated with its size • White space implies meaning when there is none intended • Ascenders and descenders can also effect focus • Eye moves around erratically, no flow or guides for visual focus • Proximity does not hold meaning • The paragraph-style layout makes it quite arbitrary which terms are above, below, and otherwise near which other terms • Position within paragraph has saliency effects • Visual comparisons difficult (see Tufte)
Weirdnesses • Meaningful associations are lost • Where are the different country names in this tag clouds?
Weirdnesses Which operating systems are mentioned?
Tag Cloud Study (1) • First part compared tag cloud layouts • Independent Variables: • Tag size • Tag proximity to a large font • Tag quadrant position • Task: recall after a distractor task • 13 participants; effects for size and quadrant • Second part compared tag clouds to lists • 11 participants • Tested recognition (from a set of like words) and impression formation • Alphabetical lists were best for the latter; no differences for the former Getting our head in the clouds: Toward evaluation studies of tagclouds, Walkyria Rivadeneira Daniel M. Gruen Michael J. Muller David R. Millen, CHI 2007 note
Tag Cloud Study (2) • 62 participants did a selection task • (find this country out of a list of 10 countries) • Independent Variables: • Horizontal list • Horizontal list, alphabetical • Vertical list • Vertical list, alphabetical • Spatial tag cloud • Spatial tag cloud, alphabetical • Order for non-alphabetical not described • Alphabetical fastest in all cases, lists faster than spatial • May have used poor clouds (some people couldn’t “see” larger font answers) • An Assessment of Tag Presentation Techniques; Martin Halvey, Mark Keane, poster at WWW 2007.
A Justifying Claim • You get three dimensions simultaneously! • alphabetical order • size indicating importance • the tags themselves … but is this really a conscious design decision?
Solution: Celebrity Interviews • I was really confused about tag clouds, so I decided to ask the people behind the puffs • 15 interviews, conducted at foocamp’06 • Several web 2.0 leaders • 5 more interviews at Google and Berkeley
A Surprise • 7 interviewees DID NOT REALIZE that alphabetical ordering is standard. • 2 of these people were in charge of such sites but had had others write the code • What was the answer given to “what order are tags shown in?” • hadn’t thought about it • don’t think about tag clouds that way • random order • ordered by semantic similarity • Suggests that perhaps people are too distracted by the layout to use the alphabetical ordering
Suggested main purposes: • To signal the presence of tags on the site • A good way to get the gist of the site • An inviting and fun way to get people interacting with the site • To show what kinds of information are on the site • Some of these said they are good for navigation • Easy to implement
Tag Clouds as Self-Descriptions • Several noted that a tag cloud showing one’s own tags can be evocative • A good summary of what one is thinking and reading about • Useful for self-reflection • Useful for showing others one’s thoughts • One example: comparing someone else’s tags to own’s one to see what you have in common, and what special interests differentiate you • Useful for tracking changes in friends’ lives • Oh, a new girl’s name has gotten larger; he must have a new girlfriend!