Download
1 / 29
290 likes | 437 Views
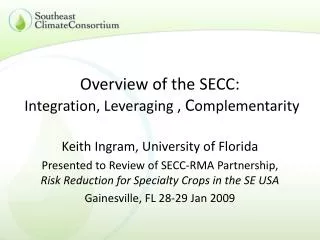
Overview of the SECC Water Group. Chris Martinez Associate Professor Department of Agricultural and Biological Engineering University of Florida. Recent activities at Auburn (SARP Grant).

E N D
Overview of the SECC Water Group Chris Martinez Associate Professor Department of Agricultural and Biological Engineering University of Florida
Recent activities at Auburn (SARP Grant) • Completed the NOAA-SARP project “Reducing Drought Risks in the Southeast USA: Quantification of Drought Information Value, Development of Drought Indices, and Communication of Drought Information” • Resulted in five peer-reviewed manuscripts, two book chapters, two extension publications, and a number of presentations. • Last manuscript on the “Value of ENSO-Forecasted Drought Information for the Management of Water Resources of Small- to Mid-Size Communities in the Southeast US” is currently in review. • Engagement of stakeholders and relationship with NIDIS.
Community Water Deficit Index – Prototype (SARP Grant) • Keith Ingram, PuneetSrivastava, SivasrinivasAmara, Jin Wu Zhong, VaishaliSharda • The Community Water Supply Index prototype allows a water manager to: • Add supply and demand watersheds • Details about population, per capita residential water consumption, reservoir characteristics, and desired reservoir storage levels • Estimate CWSI and forecast water supply and drought for their system 3 to 6 months in advance based on the ENSO conditions Aug 21,2011
Recent activities at Auburn (RISA Grant) • GolbaharMirhosseinni, PuneetSrivastava, Lydia Stefanova • Climate Change Impact on Rainfall Intensity-Duration-Frequency (IDF) Curves in Alabama Using Dynamically-Downscaled Precipitation Data (Published Regional Environmental Change) • Two more papers in review. • Objectives: • Quantify climate change impacts on IDF curves for Alabama using 3-hourly data from NARCCAP • Estimate extreme rainfall using Artificial Neural Networks (ANNs) • Develop probability based IDF curves
Forecasting Streamflows in the Apalachicola-Chattahoochee-Flint River Basin Using Ensemble Streamflow Predictions (NIDIS Grant) • Golbahar Mirhosseini, Puneet Srivastava, Keith Ingram, Latif Kalin • Ensemble Streamflow Predictions (ESP) from the Southeast River Forecast Center (SERFC) in the basin, to develop a streamflow and stage forecasting tool • Evaluate approaches (e.g. analog, ENSO trend, combined analog) to streamflow forecasting • Develop a prototype streamflow and stage forecasting tool using weekly-updated EPS from the SERFC
Managing Drought in the Apalachicola-Chattahoochee-Flint (ACF) River Basin through the Development of Improved Drought Indicators and Policy Alternatives (NOAA-SARP Grant) • SubhasisMitra, Sarmistha Singh, PuneetSrivastava, Kathy Miller, David Yates, Mark Masters, Lynn Torak • Quantify the effect of climate variability on groundwater levels under different overburden conditions; • Quantify how pumping for irrigation exacerbates the effect of drought on groundwater levels and streamflows; • Develop a procedure for forecasting groundwater levels; and • Analyze pros and cons of existing drought management policies and propose a set of policy alternatives
Managing Drought in the Apalachicola-Chattahoochee-Flint (ACF) River Basin through the Development of Improved Drought Indicators and Policy Alternatives (NOAA-SARP Grant) • SubhasisMitra, Sarmistha Singh, PuneetSrivastava, Kathy Miller, David Yates, Mark Masters, Lynn Torak • Determine locations of surface water-groundwater connectivity in the Flint River Basin • Determine how this connectivity affects streamflowin the Flint River during extended droughts • Develop a stream flow (mainly baseflow) forecasting tool for the Flint River
Current activities at Auburn (RISA Grant) • Nafiul Islam, Sarah Richard, and PuneetSrivastava • Evaluating Climate Change Impact on Revised Universal Soil Loss Equation (RUSLE) Erosivity Factor (R-factor) in the Southeast Using Dynamically-Downscaled Precipitation Data • Effect of Climate Variability on Rainwater Harvesting Systems
GriDSSAT Makes the NASA Earth Sciences Applied Science Annual Report http://appliedsciences.nasa.gov/pdf/2012AnnualReport_508.pdf
Current Status • GriDSSAT ran daily for the 2013 growing season • Single corn cultivar • Single soil per county • Latitude dependent planting date • Automatic fertilizer application to minimize nitrogen stress
Daily Products Available through the GriDSSAT website http://gridssat.nsstc.uah.edu/
Weekly products sent to state, regional & national stakeholders
Long-term GriDSSAT Runs • We are currently running GriDSSAT with an historic ~50 year data set. • This allows us to put daily and/or yearly values in an “historic context”. • In the next slide, the 2012 “Flash Drought” is put into a 50-year context and it can be seen that for the state-wide corn crop, it trends towards the lowest yields and highest stress.
Further Analysis of 2012 Flash Drought at single location in N. AL w/ Variable Irrigation & Yields
Looking Forward • We have calibrated a new corn cultivar that more closely models North Alabama’s regional results. • We plan to calibrate separate cultivars for other corn-growing regions in the S.E. • We have developed more “realistic” fertilization routines (other than automatic) that also return results closer to reported yields. • We are incorporating other crops (soybeans, cotton & peanuts). • All of this should be available for the 2014 growing season.
WaSSI • We are currently running WaSSI in an historic mode at the HUC-8 level, driven by the GriDSSAT irrigation demand. • We now include reservoir storage into the model. • We are continuing to work towards the HUC-12 level
Fact sheet on drought basics for Extension agents and other stakeholder groups. Future fact sheets will include information on trends in precipitation across the region.
Presentation on Georgia’s past three droughts and its impacts on water resources management to the National Hydrologic Warning Council meeting in June 2013.
Bastola, S., V. Misra, and H. Li, 2013: Seasonal hydrological forecasts over the Southeastern United States Watersheds for boreal summer and fall seasons. Earth Interactions, doi:10.1175/2013EI000519.1. In press. • Nag, B., V. Misra, and S. Bastola, 2013: Validating ENSO teleconnections on Southeastern United States Hydrology. Earth Interactions, submitted. • Bastola, S., and V. Misra, 2013: Seasonal hydrological and nutrient loading forecasts for watersheds over the Southeastern United States for boreal winter and Spring seasons. JAMC, submitted.
Summer seasonal climate forecasts are useful in southeast US hydrology Number of watersheds in southeast US that display useful probabilistic skill in monthly mean streamflow anomaly predictions from FISH50. June : Lead 0 (start month of the seasonal forecast) July : 1 month lead forecast Nov : 6 month lead forecast
Winter seasonal climate forecasts are useful in southeast US hydrology Number of watersheds in southeast US that display useful probabilistic skill in monthly mean streamflow anomaly predictions from FISH50. These forecasts have been extended to produce nutrient loading. Dec : Lead 0 (start month of the seasonal forecast) Jan : 1 month lead forecast May : 6 month lead forecast
Assessing the future change of key climate variables over Florida using ranked CMIP5 model ensemble Syewoon Hwang1, Seungwoo Chang1,2, Wendy Graham1,2 Water Institute, University of Florida Agricultural and biological Engineering department, University of Florida The study goals … 1. Evaluate the skill of CMIP5 models in reproducing retrospective climatology over the state of Florida 2. Rank the GCMs based on the accuracy of various predictors (e.g., mean climatology, temporal variability, extreme frequency, etc.) for different reference datasets, climate variables, and predictors 3. Develop future ensembles (for 4 different RCP scenarios) and assess future water vulnerability over Florida for the annual cycle of monthly mean and variance of precipitation and reference evapotranspiration (ETo) Precipitation change Temperature change
GCM skill evaluation Different observations 1 Maurer’s data (Maurer et al., 2002) 2 NLDAS data 3 USGS data 4 Reanalysis data? Wind spped precipitation Tmax Tmin Different metrics Different resolutions 1 RMSE 2. Correlation 3. Others? Different predictors 1 each GCM scale 2. 0.5’X0.5’ 3. 1.0’X1.0’ 4. etc. GCM list Different predictors Different GCMs 1 d10TS'; 2 monthlyTS'; 3 4seasonalTS'; 4 annualTS'; 5 annualCVTS'; 6 annualQ95TS'; 7 annualQ99TS'; 8 monthlyQ95'; 9 monthlyQ99'; 10 d10mean'; 11 monthlymean'; 12 monthlyCV_daily'; 13 monthlyCV_monthly'; 14 d10std'; 15 monthlystd_dailydata'; 16 monthlystd_monthlydata'; Distribution of weights for each GCM (precipitation) Reliable Future information? How are the results for other variables? using other observation data as reference? at other spatial resolution? UNCERTAINTY What if we have different inferences for future change?
GEFS Daily Reference Evapotranspiration Forecasts and Implications for Water Management • Global Ensemble Forecast System (GEFS) • Forecast Analog approach • Penman-Monteith • Downscaled to NLDAS grid (12 km) Tian, D. and C.J. Martinez. J. Hyromet., In Review • Water deficit from forecasts of ARID show skill out to 5 days
Forecasting Municipal Water Demand using GEFS Forecast Analogs • Auto-regressive model (1-week forecast) • Total rainfall • # rainy days • # hot days • Demand at Lithia, FL • Improved forecast skill
Seasonal Reference Evapotranspiration Forecasts based on the Climate Forecast System v2 (CFSv2) • Downscaled to NLDAS grid (12 km) • Penman-Monteith • Best skill in winter Tian, D. Martinez, and W.D. Graham. J. Climate, In Review BSS Below BSS Near BSS Above MSESS BSS Below BSS Near BSS Above • Skill greatest during ENSO events Lead Time
Seasonal Downscaling of the National Multi-Model Ensemble (NMME) • Skill of Niño 3.4 region • Downscaled to NLDAS grid (12 km) • Direct Model P & T Output • Local Regression using Niño 3.4 • Multi-model ensemble performed as well as “best” single model • Little added-value of direct model output of P & T Tian, D. Martinez, Graham, W.D. and S. Hwang. J. Hydromet., In Review
…to increase the regional relevance and usability of climate and sea level rise models for water suppliers and resources managers in Florida Learning Network Actionable Science • Building Community • Shared Interests • Building Identity • Managing Diversity • Sustainability • Rigorous Science • User Perspective • Varied Contexts • Communicating Science Partners 6 Water Utilities 4 Universities 3 Water Mgt Districts Local governments Public Growing strong -3 years—10 workshops--25 participants–2 funded projects- proposals-papers-new knowledge-searchable website FloridaWCA.org This work is partially funded under a grant from the Sectoral Applications Research Program (SARP) of the National Oceanic and Atmospheric Administration (NOAA) Climate Program Office.