Download
1 / 12
120 likes | 151 Views
Explore MOL Group's strategy as a top oil and gas company in Europe, with state-of-the-art assets, strong partnerships, and exceptional financial performance. Learn about their key businesses in exploration, production, gas transmission, refining, marketing, and petrochemicals.

E N D
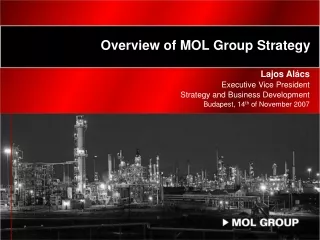
Overview of MOL Group Strategy Lajos Alács Executive Vice President Strategy and Business Development Budapest, 14th of November 2007
A Leading European Integrated Oil and Gas Company • One of the bestperforming integratedenergy companies in the world • Leader in coremarkets of Hungary,Slovakia and in Croatia via INA • State of the artasset base servingahigh growth downstream region • Highly successful regional partnerships: Slovnaft, TVK, INA • Management with outstanding trackrecord in operationalintegration and efficiency improvement Operational integration DOWNSTREAM UPSTREAM E&P GasTransmission R&M Petrochemicals TVK ( 94.9%)* MOL Plc. Slovnaft ( 98.4 %) INA ( 25.0%+1 share) *direct and indirect influence Shareholding structure(%) (approximate) (01.10.2007) 2
Key financial indicators • (*) In converting HUF financial data into US Dollars the following rates were used: for 2004: 202.6 HUF/USD for 2005:199.7 HUF/USD, for 2006: 210.5 HUF/USD. • (**) Operating profit excluding the HUF 82.6 bn one-off gain on the gas transaction and the profit of the subsidiaries sold in this transaction (Wholesale and Storage). • (***) Excluding HUF 82.6 bn one-off gain on the gas transaction. 3
Main businesses of MOL Group • Exploration and production • Sizeable domesticactivity since 1937 and focused international activitiessince early 1990s • Production in 2006: 102,618 boe/day (48% gas – 52% oil) • Proven reserves in 2006: 331.5 mm boe incl 25% of INA (66% gas – 34% oil) • Gas transmission • 5,226 km high-pressure natural gas pipeline network across Hungary • Regulated domestic business with stable cash flow • Transit activity to Serbia and Bosnia-Herzegovina • Refining and Marketing • 2 complex refineries with capacity of 14.2 mtpa (NCI above 10) • Turning high sulphur content Ural into quality products • Pipeline based supply, extensive product pipeline and depot system • 838 filling stations in 8 countries • IES closing expected in Q4 2007 • Petrochemicals • Largest polymer player in Central Europe (839 kt ethylene and 1281 kt polymer capacity) • Majority of sales in high growth, converging European market • Full operational integration with Downstream business 4
Exploration & Production Focused upstream portfolio with potential for significant growth H RUS RUS CR KAZ KAZ H H RO RO CR CR Production Reserve SYR SYR mboe boepd ALG ALG EGY EGY PAK PAK LBA LBA I I OM OM YEM YEM MOL MOL INA INA Potential Potential new new core core markets markets PRODUCTION PRODUCTION ANG ANG EXPLORATION EXPLORATION 5
Refining & Marketing High quality refining assets combined with unique logistics • Key target: refined product sales exceeding 25 mtpa • Pipeline based crude supply and alternativeimport route • Group level SCM optimisation • MOL, SN complex refineries produce only EU 2009 quality products • Extensive proprietary product pipeline logistics • Efficient regional depot system Friendship oil pipeline Friendship I Capacity: 20 mtpa PL D D Friendship Il Capacity: 7.9 mtpa CZ Adria JANAF Capacity: 10 mtpa UKR Refineries A BRATISLAVA Capacity: 6.1 mtpa NCI: 11.5 H DUNA Capacity: 8.1 mtpa NCI: 10.6 SLO RO SISAK Capacity: 2.2 mtpa NCI: 6.1 BIH I SCG RIJEKA Capacity: 4.5 mtpa NCI: 5.8 BG AL IES* Capacity: 2.6 mtpa NCI: 8.4 Refineries MOL Group depots used INA depots used MK Friendship oil pipeline Adria oil pipeline Product pipeline * Transaction is expected to be closed in Q4 2007 6
0 500 1000 Refining & Marketing Retail: Develop an efficient network within our refineries’ supply radius Optimisation of existing network • Key target: develop an efficient retail network of 1500 filling stations • Retail is strongly integrated with refining and wholesale activities, enabling the capture of synergies • MOL: 838 FSs (incl. Tifon)INA: 454 FSs • Closing in progress:IES (Ita): 5 COCO, 30 CODO, 126 DODO Potential growth through greenfield or acquisition PL D 30 CODO 1,41 UKR 209 CODO CZ 2,70 SK A 1,82 34 CODO H 320 COCA 43 DODO 3,52 128 CODO 10 COCO SLO 4,34 36 COCO RO 3,40 4,78 6 28 COCO 41 HR BIH 407 67 SCG 1,20 3,38 MOL Group filling stations INA filling stations MOL-INAJV filling stations Average site throughput per year (Mlitre) km 7
Outstanding profitability in Europe in Core Businesses Europe’s Highest Net Cash Refining Margin ($/bbl) European Upstream Net Income ($/boe, 2005) (1) $/bbl Average = $17/bbl Source: John S. Herold, Harrison Lovegrove (1) 2006 results are not yet available Source: Wood Mackenzie, 2007 Source: Wood Mackenzie 8
Independent value creating strategy • Strong track record in delivering profitable growth to continue • Superior profitability in core businesses versus European peers (Downstreamand Upstream) • Strong market position • Significant unrecognised organic upside potential • A number of high-growth organic projects are not fully recognised by the market • MOL’s high-quality asset base and unique expertise will be leveraged • EBITDA CAGR of 6.5% expected through 2011, EBITDA reaching USD 3 billion • Clear vision of corporate development strategy (M&A and partnerships) • Actively evaluating various acquisition opportunities • Strong and disciplined M&A track record • Continuing to pursue business partnerships in order to maximise shareholder value • Favourable geographical location enables us to capitalise on partnerships with suppliers and customers • Commitment to maintain efficient capital structure • Enables us to continue our focused M&A activity • Provides flexibility to distribute even more cash back to shareholders MOL’s stated independent strategy creates the highest value for our shareholders 9
Leveraging on organic growth potential… • Refining and Marketing • Duna Refinery Hydrocracker project to boost capacity & profitability • Increasing electricity integration should drive cost savings • Exploration and Production • Intensive use of acreage through partnerships in Hungary • Replicating Hungarian E&P success internationally • Strong exploration portfolio with proven track record based on recent transactions • Petrochemicals • Further efficiency improvements on back of merging TVK and Slovnaft petchem operations • 4% capacity expansion till 2011 through intensification and debottlenecking • Stronger sales based on improved marketing strategy • Natural Gas • Doubling gas transit business through new international pipeline connections • New Hungarian gas storage business: profitable, stable upside • Power generation • 2 gas fired power plants in Százhalombatta and Bratislava • Targeted 2007-2010 total organic Capex: $5.3 Bn (without power generation) 10
… while having a strong track record in inorganic growth and actively pursuing new opportunities • Recently announced transactions: • Agreement on acquisition of 40% non-operating interest of an offshore exploration block in Cameroon • Signature of Production Sharing Agreements in Kurdistan (2 exploration blocks with 80% and 20% paying interest) • MOL enforces strict evaluation criteria that focus on strategic, financial and operational targets • Investments passing these criteria provide robust returns 11
Regional leader in Corporate Governance • R A T I N G „MOL is a leading corporate governance actor in Central and Eastern Europe and clearly exceeds the average performance of companies in developed economies particularly in its disclosure standards and its board structure and functioning.” Source: ISS Corporate Services Inc. (former Deminor) – Corporate Governance Rating & Investor Report, 7June2007 12