Download
1 / 30
310 likes | 325 Views
Explore the current status and future direction of external factors influencing your industry and the global economy. Conduct an analysis to develop strategies, tactics, short-term and long-term goals to navigate this changing landscape.

E N D
MSU is an Affirmative Action, Equal Opportunity Institution. MSU Extension programs and materials are open to all without regard to race, color, national origin, sex, handicap, age or religion. Issued in furtherance of Cooperative Extension work in agriculture and home economic, acts of May 8, and June 30, 1914, in cooperation with U.S. Department of Agriculture. Arlen Leholm, director, MSU Extension, Michigan State University, E. Lansing, MI 48824
External Forces Impacting Your Industry and the Global Economy --Current Status and Future Direction
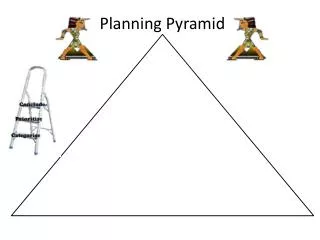
Strategic Planning Pyramid Internal External Analysis Analysis Tactics Short-term Goals Long-term Goals Mission
External Analysis • External Analysis: • Events beyond the farm gate have a tremendous financial impact upon your farm business. • Let us take a brief look at the General Economic Situation --
By Some Accounts, Things Look Great . . . • “These are the best economic times in living memory.” • Robert Shapiro • U.S. Commerce Department Undersecretary • “We broke the record for the longest peacetime expansion in American history.” • Lansing State Journal • pg. 5B, Jan. 30, 1999
By Other Accounts, Things May Not Look So Great . . . • Record low prices in hog market • Continued depressed price for cattle • Low crop prices • Tough times for cherry and apple producers • Lingering uncertainty about the Asian financial crisis • Uncertainty as to the future of U.S. farm policy
U.S. Agricultural Exports and Trade Balance 1994 1995 1996 1997 1998 1999 proj: (Nov. ‘98) Value Billion dollars Exports 43.9 54.6 59.8 57.3 53.6 50.5 Imports 26.6 29.9 32.6 35.8 37.0 38.5 Balance 17.3 24.7 27.2 21.5 16.6 12.0 VolumeMillion metric tons Exports 127.5 169.7 158.4 147.3 142.0 148.7 149.8 Data reflect years ending Sept. 30 (source: USDA WAO Board, Economic Research Service, Foreign Agricultural Service) U.S. Agricultural Trade Balance is declining!
Trade Balance Impacted by: • Asian Flu. . . Demand is down • Brazilian Currency Devaluation • Makes U.S. exports relatively more expensive
Three Key Elements of Freedom to Farm • Target prices replaced with fixed payments • Production Flexibility Contract payments (PFC) • Setasides and base rules eliminated • Minimal safety net provided by loan rates
CHANGES IN HARVESTED ACREAGE UNDER FTF MillionAcres
CHANGES IN MI HARVESTED ACREAGE UNDER FTF Thousand Acres
Changes in acreage: USMI Corn +14% -8% Wheat -3% -8% Soybeans +16% +26% Cotton -34% NA Rice +3% NA Planting Flexibility
Income Protection • PFC Payments • Fixed and declining • Less protection than target prices • Loan Deficiency Payments • Protection for entire crop
PROJECTED CORN PRICE AND PAYMENTS Dollars per Bushel
PROJECTED WHEAT PRICE AND PAYMENTS Dollars per Bushel
Policy Consistency • Timing of payments • A factor in cash rent/land price inflation? • Increasing planning uncertainty • Can we expect changes in payments?
Dr. Dave’s Predictions for 1999 • Congress will adjust PFC payments by at least 50 percent • Fast track will not pass Congress • Loan rates will not be changed until 2000 • 1999 begins a 4-year debate on farm policy • In 2002 and beyond - all alternatives are on the table!
Outlook for U.S. Commodities By Jim Hilker, Ph.D. and John Ferris, Ph.D. MSU Department of Agricultural Economics
Table 1: Corn ProductionUSDA SUPPLY/DEMAND BALANCE SHEET (million acres) - March 3, 1999 1995-96 1996-97 Estimated Projected Hilker 1997-98 1998-99 1999-Y2K Acres set aside 6.2 0.0 0.0 0.0 0.0 Acres Planted 71.2 79.5 79.5 80.2 79.2 Acres Harvested 65.0 73.1 72.7 72.6 72.4 Bu./ 113.5 127.1 126.7 134.4 131.4 Harvested acre
Table 1: Corn UseUSDA SUPPLY/DEMAND BALANCE SHEET (million bushels) - March 3, 1999
Table 2: Wheat ProductionUSDA SUPPLY/DEMAND BALANCE SHEET (million acres) - March 3, 1999
Table 2: Wheat UseUSDA SUPPLY/DEMAND BALANCE SHEET FOR (million bushels) - March 3, 1999
Table 3: Soybean ProductionUSDA SUPPLY/DEMAND BALANCE SHEET (million acres) - March, 1999
Table 3: Soybean UseUSDA SUPPLY/DEMAND BALANCE SHEET - March 3, 1999
Low Grain and Soybean Prices Translates into Low Energy and Protein Costs for the Livestock Sector