Download

1 / 78
780 likes | 802 Views
This study analyzes the effectiveness of conservation programs in reducing phosphorus loadings in the Little Bear River watershed. It examines water quality monitoring programs, identifies strengths and weaknesses, and makes recommendations for targeted agricultural practices.

E N D
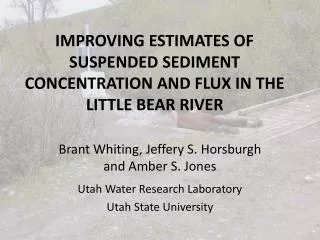
The effectiveness of conservation efforts in the Little Bear River Watershed Douglas Jackson-Smith: SSWA Dept, USU Nancy Mesner: WATS Dept, USU David Stevens, Jeff Horsburgh, Darwin Sorensen: CEE Dept, USU
Overview Background Analysis of Existing WQ Data Implementation & Maintenance Study Alternative Approaches – Riparian Study Targeting Critical Areas Common BMP Monitoring Problems Rethinking Monitoring
USDA’s Conservation Effectiveness Assessment Projects National Assessment Watershed Studies Bibliographies and Lit Reviews
CEAP Program Objectives • Determine whether publicly-funded programs to reduce phosphorus loadings from nonpoint sources into surface waters in the Little Bear River watershed are effective; • Examine the strengths and weaknesses of different water quality monitoring programs; and • Make recommendations to stakeholders to ensure that future agricultural management efforts are targeted towards the most effective and socioeconomically viable BMPs.
USU Project Overview • Original LBR watershed project (~1990-2002) • Funds from HUA; EPA 319; EQIP • USU Conservation Effects Assessment Program (CEAP) Grant – 2005-2009 • Assess effects of historical conservation practices • Review historical data • Map practices and their implementation • Model watershed and stream response • Outreach and education • Establish water quality monitoring network
Pre-treatment problems: Bank erosion, manure management, flood irrigation problems
Treatments: • bank stabilization, • river reach restoration, • off-stream watering, • manure and water management, • grazing management
Seasonal Kendall Trend for TP concentration at Mendon Rd (mouth of LBR). Conservation project initiation Slope -0.0043 mg/L yr Since 1992 No Significant slope before 1990
Ambient Monitoring DataLittle Bear at Paradise Moist Dry ConsProjects ‘Normal’ Dry
OBSERVATIONS • Trends suggest water quality improvements • Data Record Insufficient to • Tease out Exogenous Variables – project coincided with changes in background climate conditions • Link Trends to BMP Implementation • Support Traditional Modeling Approaches
Socioeconomic Component BEHAVIOR PROGRAM SIGNUP WATER QUALITY CONTRACTED BMPS IMPLEMENTATION MAINTENANCE
Socioeconomic Methods • Gather formal practice info from NRCS files • Went through every file – 90 landowners • Create master list of practices (871 total) • Copied key maps for interviews • Conduct field interviews with participants • Validate file information • Contacted 70 of 90 participants • 55 agreed to be interviewed • 61% of all landowners; 79% of those we contacted • Conducted field interviews - ~90 minutes • Detailed discussoin about BMP experience
Findings - Implementation • Individual BMPs • 83% of BMPs successfully implemented • Reasons for non-implementation (17%) • Some cases – not recognized as contracted BMP • Many – management practices that did not change behavior (based on interview discussion) • Farm-Level • 32% farms implemented all BMPs • 60% farms implemented more than ½
Maintenance of BMPs • Is it still there? If not, why not? • Overall – • 21% of implemented BMPs not still there • Combined with non-implemented practices = 1/3 of all originally contracted BMPs not currently there • Why not maintained? • No longer farming or sold land – 32% • Still farming, no longer use – 68%
Implications: Maintenance • Good news: • Producers did not discontinue the practices because they did not like them • Not so good news: • The management practices had the shortest lifespan • ALSO: Nonfarm Development and Farm Changes can also affect long term impacts
Implications: Implementation • Management practices are the heart of conservation programs • Failure to fully implement may have huge impacts on success • Big Question: How can management behaviors be implemented more effectively?
Videography Analysis Component • Limitations to WQ monitoring data in 1990s • Search for alternative indicators of BMP impact • Discussions with colleagues led to discovery of 1992 aerial 3-band videography for stretches of LBR • Arranged to re-fly the river in 2007
Analysis Strategy • Match images from 1992 and 2007 • Classify vegetative conditions for both time periods within identical riparian zones • Riparian trees • Small shrubs & grasses • Bare soil • Water & Shadows • Quantify changes in riparian vegetation and stream geomorphology between 1992-2007 • Associate presence or absence of ‘riparian-relevant’ BMPs to these changes
‘Riparian Area’ Focused BMPs • Stream channel structural BMPs • Clearing & snagging (326) • Streambank and shoreline protection (580) (13,825’) • Stream channel stabilization (584) • Stream access controls for livestock • Riparian fencing (5383) – subset of 382 • Stream crossing (578) • Riparian vegetation BMPs • Channel vegetation (322) • Critical area planting (342) • Tree/Shrub establishment (612)
2007 digital images 1992 video images
Site: Upstream from Hyrum Dam 1992 Multispectral Mosaic 2007 Multispectral Mosaic Detail
Initial Observations • Significant vegetation growth • Trees significantly larger throughout watershed • Significant geomorphologic changes in main stream channel path • Moving centerline • New ‘islands’ • Major bank cuts & shifts in some new erosion • BIG QUESTION: Is it because of BMPs?
1992 2007
1992 2007
STATISTICAL RESULTS • Calculate area for each of 5 different vegetative classes • PREVIEW: analysis approach • Document overall patterns of change • Shows the ‘background’ trends • Compare changes in “BMP impact zones” • Aggregated riparian-relevant BMPs • Individual riparian-relevant BMPs • Comparison to Non-BMP areas
Quick Summary • Riparian conditions improving throughout watershed (more trees, less exposed soil) • BMPs installed in areas with less vegetation • BMPs associated with much more rapid growth in tree cover, similar rates of decline in exposed soil • Fences = reduced exposed soil most • Instream work = increased trees the most
Idea behind Targeting… • Growing Recognition of Landscape Variability • Research Q: Is there evidence that the BMPs implemented in LBR specifically targeted critical areas? • Critical Areas: areas where the potential contribution of pollutants (i.e., sediments, phosphorus) to the receiving water is significantly higher than other areas
Combined Map of Risk Zones
62% 23% Covered By BMPs 47% 47%
Implications: Spatial Analysis • Evidence exists that higher risk zones were targeted with BMPs (not random) • More than ½ of riskiest areas covered by BMPs • More than 70% of BMPs in zones that are not considered at high risk for runoff erosion • Suggests opportunity for greater targeting & efficiency • Related to structure of program
Lessons Learned: Common problems in BMP monitoring programs Failure to design monitoring plan around BMP objectives Failure to identify and quantify sources of variability in these dynamic systems. Failure to understand pollutant pathways and transformations choosing inappropriate monitoring approaches
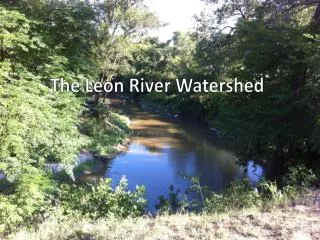
v Little Bear River Watershed, Utah
Total Observations at Watershed Outlet site Discharge Total phosphorus 1976 - 2004: 162 241 1994 - 2004: 72 99 1994 11 13 1995 10 13 1996 10 13 1997 11 4 1998 6 10 1999 7 10 2000 6 5 2001 4 7 2002 2 8 2003 4 8 2004 1 8 Number of observations each year
Was the original UDWQ monitoring program a failure? No….Program was intended to detect exceedences of water quality criteria. The failure was ours…. In attempting to use these monitoring data for detecting change in loads
Failure to design monitoring plan around BMP objectives • Failure to identify and quantify sources of variability in these dynamic system. • A failure to understand pollutant pathways and transformations choosing inappropriate monitoring approaches
“lower watershed site” “upper watershed site”