Download
1 / 49
510 likes | 719 Views
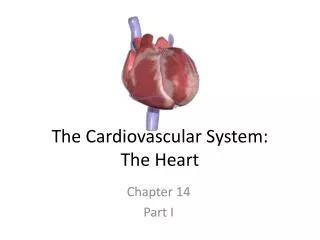
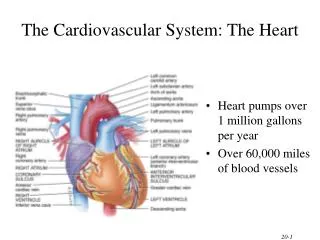
The Cardiovascular System: The Heart. Heart pumps over 1 million gallons per year Over 60,000 miles of blood vessels. Heart Location. Apex - directed anteriorly, inferiorly and to the left Base - directed posteriorly, superiorly and to the right

E N D
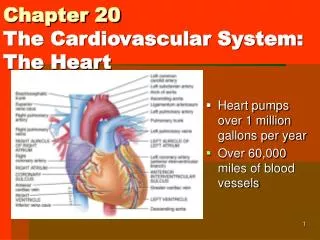
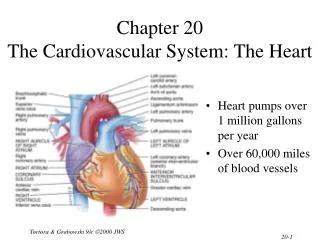
The Cardiovascular System: The Heart • Heart pumps over 1 million gallons per year • Over 60,000 miles of blood vessels
Heart Location • Apex - directed anteriorly, inferiorly and to the left • Base - directed posteriorly, superiorly and to the right • Anterior surface - deep to the sternum and ribs • Inferior surface - rests on the diaphragm • Right border - faces right lung • Left border (pulmonary border) - faces left lung • Heart is located in the mediastinum • area from the sternum to the vertebral column and between the lungs
Pericardium • Fibrous pericardium • dense irregular CT • protects and anchors the heart, prevents overstretching • Serous pericardium • thin delicate membrane • contains • parietal layer-outer layer • pericardial cavity with pericardial fluid • visceral layer (epicardium) • Epicardium • visceral layer of serous pericardium • Myocardium • cardiac muscle layer is the bulk of the heart • Endocardium • chamber lining & valves
Myocardium – cardiac muscle • shares structural and functional characteristics with both skeletal and smooth muscle • skeletal & cardiac – striated • thin filaments contain troponin and tropomyosin – regulates cross-bridge formation • possess a definitive tension-length relationship • plentiful mitochondria and myoglobin • well-developed T-tubule structure • smooth & cardiac – calcium enters the cytosol of the muscle cell from the SR and the ECF during excitation • through voltage-gated calcium channels in the PM and the T-tubule membrane – dihydropyridine receptors • calcium entry from the ECF triggers its release from the SR • displays pace-makes activity – initiates its own APs without external influence • interconnected by gap junctions (intercalated discs) – enhance the spread of APs • innervated by the ANS • unique – 1. cardiac muscle fibers are joined in a branching network • 2. action potentials last longer than skeletal before repolarization
Right Ventricle Right Atrium • Receives blood from 3 sources • superior vena cava, inferior vena cava and coronary sinus • Interatrial septum partitions the atria • Fossa ovalis is a remnant of the fetal foramen ovale • Tricuspid valve • Blood flows through into right ventricle • has three cusps composed of dense CT covered by endocardium • Forms most of anterior surface of heart • Papillary muscles are cone shaped trabeculae carneae (raised bundles of cardiac muscle) • Chordae tendineae: cords between valve cusps and papillary muscles • Interventricular septum: partitions ventricles • Pulmonary semilunar valve: blood flows into pulmonary trunk
Left Ventricle Left Atrium • Forms the apex of heart • Chordae tendineae anchor bicuspid valve to papillary muscles (also has trabeculae carneae like right ventricle) • Aortic semilunar valve: • blood passes through valve into the ascending aorta • just above valve are the openings to the coronary arteries • Forms most of the base of the heart • Receives blood from lungs - 4 pulmonary veins (2 right + 2 left) • Bicuspid valve: blood passes through into left ventricle • has two cusps • to remember names of this valve, try the pneumonic LAMB • Left Atrioventricular, Mitral, or Bicuspid valve
Atrioventricular Valves • A-V valves open and allow blood to flow from atria into ventricles when ventricular pressure is lower than atrial pressure • occurs when ventricles are relaxed, chordae tendineae are slack and papillary muscles are relaxed • A-V valves close preventing backflow of blood into atria • occurs when ventricles contract, pushing valve cusps closed, chordae tendinae are pulled taut and papillary muscles contract to pull cords and prevent cusps from everting Semilunar Valves • SL valves open with ventricular contraction • allow blood to flow into pulmonary trunk and aorta • SL valves close with ventricular relaxation • prevents blood from returning to ventricles, blood fills valve cusps, tightly closing the SL valves
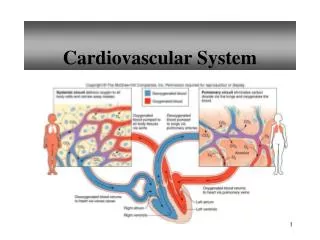
Blood Circulation • Systemic circulation • left side of heart pumps blood through body • left ventricle pumps oxygenated blood into aorta • aorta branches into many arteries that travel to organs • arteries branch into many arterioles in tissue • arterioles branch into thin-walled capillaries for exchange of gases and nutrients • deoxygenated blood begins its return in venules • venules merge into veins and return to right atrium • Pulmonary circulation • right side of heart pumps deoxygenated blood to lungs • right ventricle pumps blood to pulmonary trunk • pulmonary trunk branches into pulmonary arteries • pulmonary arteries carry blood to lungs for exchange of gases • oxygenated blood returns to heart in pulmonary veins
SVC/IVCRight Atrium(tricuspid valve)Right Ventricle Passage of Blood through the Heart Body (pulmonary semilunar valve) Pulmonary Arteries Lungs Pulmonary Vein Left Atrium bicuspid (mitral) valve Body Left Ventricle Aorta (aortic semilunar valve)
Conduction System of Heart • two types of cardiac muscle cells • 1. contractile cells • 99% of cardiac muscle cells • Do mechanical work of pumping • Normally do not initiate own action potentials • 2. autorhythmic cells • Do not contract • Specialized for initiating and conducting action potentials responsible for contraction of working cells • intercalated discs – join cardiac cells • two types of membrane junctions • a. desmosomes – abundant in tissues under considerable stress • formation of a proteinaceous plaque on each PM surface (desmoglein, desmocollin) • plaques are joined to each other by adhesion proteins – cadherins (require calcium for interaction) • cadherins link to the underlying cytoskeleton (intermediate filaments) • b. gap junctions – two PMs are connected by a “channel” made of specific proteins = connexons • connexons are 6 protein subunits that form a hollow tube-like structure • two connexons join end to end to connect the cells • allow a free flow of materials from cell to cell • allow for the spread of electricity within each atrium and ventricle • no gap junctions connect the atrial and ventricular contractile cells – block to electrical conduction from atria to ventricle!!! • also a fibrous skeleton the supports the valves – nonconductive • therefore a specialized conduction system must exist to allow the spread of electricity from atria to ventricles
SA node = 1. cluster of cells in wall of Rt. Atria begins heart activity that spreads to both atria excitation spreads to AV node AV node = 2. in atrial septum, transmits signal to bundle of His AV bundle of His = 3 & 4. the connection between atria and ventricles divides into bundle branches &purkinje fibers, large diameter fibers that conduct signals quickly Conduction System of Heart
Rhythm of Conduction System • SA node fires spontaneously 90-100 times per minute • AV node fires at 40-50 times per minute • If both nodes are suppressed fibers in ventricles by themselves fire only 20-40 times per minute • Artificial pacemaker needed if pace is too slow • Extra beats forming at other sites are called ectopic pacemakers • caffeine & nicotine increase activity
failure of SA node blockage of transmission from SA through the AV node Normal pacemaker activity • various autorhythmic cells have different rates of depolarization to threshold – so the rate of generating an AP differs • AP propagated through gap junctions or through the conduction system of the heart • contraction rate is driven by the SA node – fastest autorhythmic tissue • in some cases – the normally slowest Purkinje fibers can become overexcited = ectopic focus • premature APs • premature ventricular contraction (PVC) • occurs upon excess caffeine, alcohol, lack of sleep, anxiety and stress • some organic conditions can also lead to this
Cardiac excitation • efficient cardiac function requires three criteria • 1. atrial excitation and contraction should be complete before ventricular excitation and contraction • opening and closing of valves within the heart depend upon pressure – which is generated by muscle contraction • so simultaneous contractions of atria and ventricles would lead to permanent closure of the AV valves – myocardium of the ventricles is larger and stronger • normally – atrial excitation and contraction occurs about 160 msec before ventricular • 2. cardiac fiber excitation should be coordinated to ensure each chamber contracts as a unit • muscle fibers cannot become excited randomly • role of the gap junctions • 3. atria and ventricles should be functionally coordinated • atria contract together, ventricles contract together • permits efficient pumping of blood into the pulmonary and systemic circuits • uncontrolled excitation and contraction of ventricular cells – fibrillation • correction by: • 1. electrical defibrillation • 2. mechanical defibrillation
atrial conduction systme/interatrial pathway – spread of electricity from right to left atrium • fibers in this pathway terminate in the wall of the left atrium • APs spread through gap junctions of the myocardium of the RA at the same time they spread through the LA • SA to AV node – 30msec • internodal pathway – spread of electricity to the AV node • spreads relatively slowly through the AV node • this allows for complete filling of the ventricles before they are induced to contract = AV nodal delay • ventricular conduction system – Bundles of His and Purkinje fibers • Purkinje system – travel time = 30 msec • the PFs do not terminate at every muscle cell • so the impulse spreads via gap junctions – similar to the atrial system • most highly organized of the pathways • PFs conduct impulse 6 times faster than the ventricular muscle cells would on their own • Bundles of His also prevent the depolarization of the ventricular tissue immediately next to the AV node – more efficient pumping results • diffusion through the PFs allow for simultaneous contraction of all ventricular cells
Cardiac muscle action potentials • pacemaker potential of the autorhythmic cells • interactions by several different ionic mechanisms • 1. decreased outward K+ current • coupled with a constant inward Na+ current – cells do NOT have voltage- gated Na+ channels (constant slow leak inward) • initial phase of depolarization is slow – caused by a cyclical decrease in the passive outward K+ flow coupled to a slow unchanging leak of Na+ into the cell • because the permeability of the PM to K+ changes in cardiac cells (in contrast to neurons - Na) • decreases between depolarizations – leak K+ channels close as the membrane potential turns negative – slow the leak of K+ • so the Na+ inflow doesn’t change but the K+ flow decreases – membrane constantly drifts toward threshold • 2. increased inward Ca+ current • T-type Ca+ channels (voltage-gated) open as the membrane drifts toward threshold – open before threshold is reached • brief influx of Ca increases the depolarization • at threshold – L-type Ca channels open – longer lasting voltage-gated channel • greater influx of calcium – so the influx of calcium (rather than Na) is what drives the membrane potential of a cardiac cell toward positive • resets through the closing of these Ca channels and the opening of voltage-gated K+ channels • provided by the SA node
Cardiac muscle action potentials • AP in the contractile cells of the myocardium are initiated by the SA node and spread via gap junctions • but the mechanism differs from that of the autorhythmic cells • 1. during the rising phase of the depolarization, the MP rapidly reverses to positive – activation of Na+ entry through voltage-gated channels (similar to neurons) = “fast” Na+ channels • 2. Na+ permeability than rapidly plummets to its resting level • 3. BUT the MP potential instead of rapidly returning to negative is held a positive for an extended period of time = plateau phase • prolongs the positivity inside the cell • 4. rapid falling phase results – inactivation of Ca+ channels and delayed opening of voltage-gated K+ channels • results in a sudden opening of K+ channels and a rapid repolarization
AP and contraction • the “slow” L-type Ca+ channels are found within the T-tubules • triggers the opening of Ca+ channels within the adjacent lateral sacs of the SR (foot proteins) – • this “Ca-induced Ca release” triggers a very large release of Ca+ from the SR • burst of Ca+ = Ca+ sparks • SR supplies 90% of the Ca+ required for contraction • together with the slow removal of Ca+ - results in a long sustained contraction of heart muscle
AP and contraction • Ca+ triggers the same series of events as seen in skeletal muscle • BUT – the amount of Ca+ release can directly affect the number of cross-brides formed in cardiac muscle and can directly affect the strength of the contraction! • so cardiac muscle must ensure adequate release of Ca+ • elevated ECF Ca+ can increase the strength of contraction • e.g. digitalis – alters the activity of the Na/K transporter = increases Ca transport into the cell • elevates intracellular contraction, increases the plateau phase which increases the strength of contraction and the duration of the contraction • e.g. verapamil – Ca+ channel blocker – blocks inflow of Ca from the ECF – decreases contraction • refractory period of cardiac muscle is longer than skeletal muscle (250msec) • cannot be restimulated until the contraction is almost over • prevents the development of tetanus • allows for the emptying of the chambers
Electrocardiogram---ECG or EKG • electrical currents generated by the heart are also transmitted through the body fluids • can be measured on the surface of the chest • therefore it is not a direct measurement of the actual electrical conductivity of the heart itself • represents the overall spread of activity through the heart during depolarization – sum of all electrical activity • measured through the placement of 6 leads on the chest wall (V1 – V6) PLUS 6 limb leads (I, II, III, aVR, aVL and aVF) • it's usual to group the leads according to which part of the left ventricle (LV) they look at. • AVL and I, as well as V5 and V6 are lateral, while II, III and AVF are inferior. • V1 through V4 tend to look at the anterior aspect of the LV • see EKG lab handouts • ECG paper is traditionally divided into 1mm squares. Vertically, ten blocks usually correspond to 1 mV, and on the horizontal axis, the paper speed is usually 25mm/s, so one block is 0.04s (or 40ms). • Note that we also have "big blocks" which are 5mm on their side.
History of the EKG • 1843 - Emil Du bois-ReymondGerman physiologist Emil Du bois-Reymond describes an "action potential" accompanying each muscular contraction. He detected the small voltage potential present in resting muscle and noted that this diminished with contraction of the muscle. To accomplish this he had developed one of the most sensitive galvanometers of his time. His device had a wire coil with over 24,000 turns - 5 km of wire. Du Bios Reymond devised a notation for his galvanometer which he called the 'disturbance curve'. "o" was the stable equilibrium point of the astatic galvanometer needle and p, q, r and s (and also k and h) were other points in its deflection. Du Bois-Reymond, E. Untersuchungen uber thierische Elektricitat. Reimer, Berlin: 1848. • 1850 - Bizarre unregulated actions of the ventricles (later called ventricular fibrillation) is described by Hoffa during experiments with strong electrical currents across the hearts of dogs and cats. He demonstrated that a single electrical pulse can induce fibrillation. Hoffa M, Ludwig C. 1850. Einige neue versuche uber herzbewegung. Zeitschrift Rationelle Medizin, 9: 107-144 • 1856 - Rudolph von Koelliker and Heinrich Muller confirm that an electrical current accompanies each heart beat by applying a galvanometer to the base and apex of an exposed ventricle. They also applied a nerve-muscle preparation, similar to Matteucci's, to the ventricle and observed that a twitch of the muscle occured just prior to ventricular systole and also a much smaller twitch after systole. These twitches would later be recognised as caused by the electrical currents of the QRS and T waves. von Koelliker A, Muller H. Nachweis der negativen Schwankung des Muskelstroms am naturlich sich kontrahierenden Herzen. Verhandlungen der Physikalisch-Medizinischen Gesellschaft in Wurzberg. 1856;6:528-33. • 1872 - Guillaume Benjamin Amand Duchenne de Boulogne, pioneering neurophysiologist, describes the resuscitation of a drowned girl with electricity in the third edition of his textbook on the medical uses of electricity. This episode has sometimes been described as the first 'artificial pacemaker' but he used an electrical current to induce electrophrenic rather than myocardial stimulation. Duchenne GB. De l'electrisation localisee et de son application a la pathologie et la therapeutique par courants induits at par courants galvaniques interrompus et continus. [Localised electricity and its application to pathology and therapy by means of induced and galvanic currents, interrupted and continuous] 3ed. Paris. JB Bailliere et fils; 1878 - British physiologists John Burden Sanderson and Frederick Page record the heart's electrical current with a capillary electrometer and shows it consists of two phases (later called QRS and T). Burdon Sanderson J. Experimental results relating to the rhythmical and excitatory motions of the ventricle of the frog. Proc R Soc Lond 1878;27:410-414 1887 - British physiologist Augustus D. Waller of St Mary's Medical School, London publishes the first human electrocardiogram. It is recorded with a capilliary electrometer from Thomas Goswell, a technician in the laboratory. Waller AD. A demonstration on man of electromotive changes accompanying the heart's beat. J Physiol (London) 1887;8:229-234 1893 - Willem Einthoven introduces the term 'electrocardiogram' at a meeting of the Dutch Medical Association. (Later he claims that Waller was first to use the term). Einthoven W: Nieuwe methoden voor clinisch onderzoek [New methods for clinical investigation]. Ned T Geneesk 29 II: 263-286, 1893 1895 - Einthoven, using an improved electrometer and a correction formula developed independently of Burch, distinguishes five deflections which he names P, Q, R, S and T. Einthoven W. Ueber die Form des menschlichen Electrocardiogramms. Arch f d Ges Physiol 1895;60:101-123 1931 - first patented pacemakerDr Albert Hyman patents the first 'artificial cardiac pacemaker' which stimulates the heart by using a transthoracic needle. His aim was to produce a device that was small enough to fit in a doctor's bag and stimulate the right atrial area of the heart with a suitably insulated needle. His experiments were on animals. His original machine was powered by a crankshaft (it was later prototyped by a German company but was never successful). "By March 1, 1932 the artificial pacemaker had been used about 43 times, with a successful outcome in 14 cases." It was not until 1942 that a report of its successful short term use in Stokes-Adams attacks was presented. Hyman AS. Resuscitation of the stopped heart by intracardial therapy. Arch Intern Med. 1932;50:283
Electrocardiogram---ECG or EKG • P wave • atrial depolarization • SA depolarization is too weak to measure • smaller than the QRS complex due to the smaller size of the atrial muscle mass • will be affected by abnormalities in the pacemaker activity of the SA node • PR segment – AV nodal delay • P to Q interval • conduction time from atrial to ventricular excitation • no net current flow within the heart musculature & the flow through the AV node is too small to measure– baseline • if activity in the AV node is abnormal – this interval ill be affected • QRS complex • ventricular depolarization • will be affected by the appearance of an ectopic focus (region of hyperactive ventricular contraction) • ST segment – time during which ventricles are contracting and emptying • ventricles are completely depolarized and the cells are in their plateau phase • T wave • ventricular repolarization • TP interval • time during which ventricles are relaxing and filling http://www.ecglibrary.com/ecghist.html http://www.anaesthetist.com/icu/organs/heart/ecg/Findex.htm
Working with the EKG • see EKG handouts • Knowing the paper speed, it's easy to work out heart rate. It's also very convenient to have a quick way of eyeballing the rate, and one method is as follows: • Remember the sequence: 300, 150, 100, 75, 60, 50 • Identify an R wave that falls on the marker of a `big block' • Count the number of big blocks to the next R wave. • If the number of big blocks is 1, the rate is 300, if it's two, then the rate is 150, and so on. Rates in between these numbers are easy to `interpolate'. • But always remember that in the heart, because we have two electrically `isolated' chambers, the atria and ventricles, that we are really looking at two rates --- the atrial and ventricular rates! • It just so happens that in the normal heart, the two are linked in a convenient 1:1 ratio, via normal conduction down the AV node. • In disease states, this may not be the case. • Conventionally, a normal heart rate has been regarded as being between 60 and 100, but it's probably more appropriate to re-adjust these limits to 50 -- 90/min.
EKG abnormalities bradycardia • tachycardia – rapid heart rate • bradycardia – slow heart rate • atrial flutter – rapid but regular series of atrial depolarizations (can be known as a paroxysmal atrial tachycardia - 150 – 200 beats/min) • 200 to 380 per minute • ventricles cannot keep pace because normally the AV node cannot transfer each atrial depolarization signal • so only one out of every 2 or 3 atrial impulses successfully passes the AV node – 2:1 or 3:1 rhythm = atrial tachycardia with AV block • this failure ensures a slower contraction rate for the ventricles • atrial fibrillation – rapid, irregular depolarization of the atria • no definitive P waves – more than 350 depolarizations per minute • chaotic, asynchronized atrial contractions • normal QRS complex in shape – occur sporadically • or the QRS complex can appear to be irregular in shape and timing (irregular irregularity) • the length of time for ventricular filling can vary dramatically – some beats will have no filling at all • with less filling is a weaker ventricular contractive force • in some ventricular contractions – not enough blood is expelled for a wrist pulse to be detected • therefore the heart rate taken at the heart will exceed that of the wrist pulse = pulse deficit tachycardia – with PVC, no discernible P or T waves ventricular tachycardia atrial flutter – 3:1 atrial fibrillation
-AV blocks can be induced medicinally through the administration of calcium channel blockers, beta-blockers, digitalis and anything that increases cholinergic activity such as cholinesterase inhibitors. • SA node activity can be normal • however, activity at the AV node can be altered = AV (nodal) block • 1st degree – prolonged AV conduction time • normal pacemaker, normal P wave • PR interval exceeds normal limit – 0.20 seconds • heart rate and rhythm unaffected • 2nd degree • greater impairment – some impulses from the atria fail to activate the ventricles • results in dropped beats • Mobitz I – long but regular PR intervals – occurs one in every 3 or 4 beats • the affected beat has no QRS complex • Mobitz II or Wenckebach phenomenon – progressive lengthening of the PR interval to the point a QRS is dropped – pattern repeats • 3rd degree – complete AV block • no impulses from the AV node travel to the ventricles • therefore a ventricular pacemaker activity must develop – Idioventricular Rhythm – 20 -45 beats/minute • grossly abnormal QRS complexes • sometimes there is a delay before the idioventricular pacemaker goes into action – during this lag there is no ventricular contraction – syncope (fainting) • called Stokes-Adams syndrome
EKG abnormalities • extrasystole – type of arrhythmia • also called a PVC • occurs from an ectopic focus – independent activity of Purkinje fibers • ventricular fibrillation = ventricular musculature exhibits uncoordinated, chaotic contractions • multiple impulses will travel erratically throughout the heart muscle • EKG will have no discernible pattern • ventricles are rendered ineffectual • heart block – defects in the conduction system • atria still beat regularly • ventricles fail to be stimulated and contract • blockage of impulses from atria to ventricles • can vary in degree from blocking every second to third transmission through the AV node (2:1 or 3:1 block) to less often • in the heart block the atrial rate will be normal but the ventricular rate will be below normal • complete heart block – no transmission to ventricles • the atria continue to beat normally • the ventricles will beat on their own rhythm and rate • see a normal P wave • slower QRS and T waves • the QRS will fail to mask atrial repolarization – this may appear on the EKG
The Heartbeat each heartbeat = cardiac cycle -SL valves close “dup” -AV valves open -filling of atria & ventricles begins -contraction of atria -AV valves open -filling of ventricles = “Ventricular Filling stage” -contraction of ventricles -AV valves close “lub” -SL valves open -blood to lungs and body **Heart Murmur**
Cardiac cycle • A. Midventricular diastole • during most of the ventricular diastole, the atrium is also in diastole = TP interval on the EKG • as the atrium fills during its diastole, atrial pressure rises and exceeds ventricular pressure (1) • the AV valve opens in response to this difference and blood flows into the right ventricle • the increase in ventricular volume rises even before the onset of atrial contraction (2)
Cardiac cycle • B. Late ventricular diastole • SA node reaches threshold and fires its impulse to the AV node = P wave (3) • atrial depolarization results in contraction – increases the atrial pressure curve (4 – green line) • corresponding rise in ventricular pressure (5 – red line) occurs as the ventricle fills & ventricular volume increases (6) • the impulse travels through the AV node • the atria continue to contract filling the ventricles • C. End of ventricular diastole • once filled the ventricle will start to contract and enter its systole phase • ventricular diastole ends at the onset of ventricular contraction • atrial contraction has also ended • ventricular filling has completed • ventricle is at its maximum volume (7) = end-diastolic volume (EDV), 135ml
Cardiac cycle • D. Start of ventricular systole • at the end of this contraction is the onset of ventricular excitation (8) = QRS complex • the electrical impulse has left the AV node and enters the ventricular musculature • this induces ventricular contraction • ventricular pressure will begin to rise rapidly after the QRS complex (red line) • this increase signals the onset of ventricular systole (9) • atrial pressure is at its lowest point as its contraction has ended and the chamber is empty (green line) • the ventricular pressure now exceeds atrial – AV valve closes
Cardiac cycle • E. isovolumetric ventricular contraction • ventricular pressure also opens the semilunar valves • however, just after the closing of the AV and opening of the SL is a brief moment where the ventricle is a closed chamber (10) = isovolumetric contraction • ventricular pressure continues to rise (red line) but the volume within the ventricle does not change (11) • F. Ventricular ejection • ventricular pressure will now exceed aortic pressure as the ventricle continues is contraction (12) • aortic SL is forced open and the ventricle empties • this volume of blood – stroke volume (SV) • the ejection of blood into the aorta increases its pressure (aortic pressure) and the aortic pressure curve rises (13 – purple line) • ventricular volume now decreases (14 – blue line) • F. End of ventricular systole • as the ventricular volume drops • BUT ventricular pressure continues to rise as the contraction increases its force (red line) – then starts to decrease as blood begins to be ejected • at the end of the systole there is a small volume of blood that remains in the ventricle – end-systole volume (ESV), 65ml (15) • EDV-ESV = SV (point 7 – point 15) • G. Ventricular repolarization • T wave – point 16 • as the ventricle relaxes – ventricular pressure falls below aortic and the aortic SL closes (17) • this closure produces a small disturbance in the aortic pressure curve – dicrotic notch (18)
Cardiac cycle • H. Isovolumetric ventricular relaxation • all valves are closed because ventricular pressure still exceeds atrial pressure – isovolumetric relaxation (19) • chamber volume remains constant (20) • I. Ventricular filling • as VP falls below AP – the AV valve opens again (21) and ventricular filling starts again increasing ventricular volume (blue line) • as the atria fills from blood from the pulmonary veins (lungs) it increases AP • with the AV valve open this blood fills the ventricle rapidly (23) • then slows down (24) as the blood drains the atrium • during this period of reduced filling, blood continues to come in from the pulmonary veins – goes directly into the ventricle • cycle starts again with a new SA depolarization
Auscultation • Stethoscope • Sounds of heartbeat are from turbulence in blood flow caused by valve closure • first heart sound (lubb) is created with the closing of the atrioventricular valves • second heart sound (dupp) is created with the closing of semilunar valves • Heart sounds
Cardiac Output • Amount of blood pushed into aorta or pulmonary trunk by a ventricle • Determined by stroke volume and heart rate • CO = SV x HR • at 70ml stroke volume & 75 beat/min----5 and 1/4 liters/min • entire blood supply passes through circulatory system every minute – each half of the heart pumps half the total volume of blood • at rest the heart pumps 2.5 million liters of blood per year! • during exercise – rise to 20 to 25 liters per minute • Cardiac reserve is the ratio of the maximum output to normal cardiac output at rest • average is 4-5 while athlete is 7-8
Stroke volume • end-diastolic volume (amount of blood in a ventricle after filling) - end-systolic volume (amount of blood left in a ventricle after systole) • SV = EDV- ESV • ESV – measured by EKG – end of the T wave • EDV – measured using MRI, CT scan or a ventriculography (catheter in the ventricle and injection of an X-ray visible dye) • two components influence SV • 1. intrinsic control • heart’s inherent ability to vary SV • depends on the direct correlation between end-diastolic volume (EDV) and stroke volume • as more blood returns to the heart, the heart pumps out more blood • BUT the heart does not eject all the blood it contains • this control depends on the length-tension relationship of cardiac muscle – similar to skeletal muscle • for skeletal muscle – resting muscle length is approximately optimal length (lo) • – when the muscle length is less than or greater than lo– muscle contraction is weak • for cardiac muscle – resting cardiac muscle length is less than lo • muscle length is determined by the extent of ventricular filling – increased ECV, increased ventricular volume • filling the ventricle with more blood stretches the cardiac muscle • as the cardiac cell is stretched – the spacing between thick and thin microfilaments is reduced • the myofilaments are pulled closer together • allows more cross-bridge formation • 2. extrinsic control • sympathetic and parasympathetic control
Regulation of Heart Rate • Nervous control from the cardiovascular center in the medulla • Sympathetic impulses increase heart rate and force of contraction • Parasympathetic impulses decrease heart rate through the vagus nerve • Baroreceptors (pressure receptors) detect change in BP and send info to the cardiovascular center • located in the arch of the aorta and carotid arteries • Heart rate is also affected by hormones and ions • epinephrine, norepinephrine, thyroid hormones • ions (Na+, K+, Ca2+) • age, gender, physical fitness, and temperature
Regulation of Heart Rate • Sympathetic impulses increase heart rate and force of contraction • supplies the atrial and ventricular musculature (including the SA and AV nodes) • speeds up contraction rate by speeding up the rate of depolarization of the autorhythmic cells of the SA node • decreases K+ permeability by inactivating K+ channels • with fewer K+ ions leaving the cell – the inside becomes less negative – depolarizing effect • swifter drift towards threshold • also reduces the AV delay by enhancing the L-type Ca+ channels • speeds the rate of conduction through the Bundles and Purkinje fibers • parasympathetic impulses decrease heart rate through the vagus nerve • primarily supplies the SA and AV nodes • little effect on ventricular conduction system or ventricular contractile cells • decreases the excitability of the AV node – increases AV delay (hyperpolarizes the AV node) • in contractile cells of the atria – shortens the AP and reduces the inward Ca+ flow shortening the plateau phase – weakened atrial contraction
Coronary Arteries • Branches off aorta above aortic semilunar valve • Left coronary artery • circumflex branch • in coronary sulcus, supplies left atrium and left ventricle • anterior interventricular art. • supplies both ventricles • Right coronary artery • marginal branch • in coronary sulcus, supplies right ventricle • posterior interventricular art. • supplies both ventricles
Stent in an Artery • Maintains patency of blood vessel
Risk Factors for Heart Disease • Risk factors in heart disease: • high blood cholesterol level • high blood pressure • cigarette smoking • obesity & lack of regular exercise. • Other factors include: • diabetes mellitus • genetic predisposition • male gender • high blood levels of fibrinogen • left ventricular hypertrophy
Plasma Lipids and Heart Disease • Risk factor for developing heart disease is high blood cholesterol level. • promotes growth of fatty plaques • Most lipids/cholesterol are transported as lipoproteins • cholesterol is unable to travel freely in the blood – combined with a protein (apolipoproteins) made in the liver = lipoprotein • low-density lipoproteins (LDLs) • high-density lipoproteins (HDLs) • very low-density lipoproteins (VLDLs) • HDLs remove excess cholesterol from circulation – travels to the liver where it is degraded • LDLs are associated with the formation of fatty plaques – LDLs are oxidized by the liver • oxidized LDL can damage endothelial linings – inflammatory response • inflammatory response leads to the accumulation of a fatty plaque at the area of damage • this plaque becomes covered with smooth muscle cells and fibroblasts • the fibroblasts can become calcified into a bone-like material • VLDLs contribute to increased fatty plaque formation • mutations in apolipoprotein genes may contribute to plaque formation also • There are two sources of cholesterol in the body: • in foods we ingest & formed by liver