Download
1 / 40
400 likes | 428 Views
Explore the restoration goals and natural production of adult Chinook salmon in Central Valley rivers from 1952 to 2010. Baseline and average numbers for different Chinook salmon races are compared, highlighting progress and challenges.

E N D
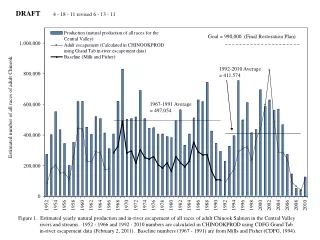
DRAFT 4 - 18 - 11 revised 6 - 13 - 11 Goal = 990,000 (Final Restoration Plan) 1992-2010 Average = 411,574 1967-1991 Average = 497,054 Estimated number of all races of adult Chinook Figure 1. Estimated yearly natural production and in-river escapement of all races of adult Chinook Salmon in the Central Valley rivers and streams. 1952 - 1966 and 1992 - 2010 numbers are calculated in CHINOOKPROD using CDFG Grand Tab in-river escapement data (February 2, 2011). Baseline numbers (1967 - 1991) are from Mills and Fisher (CDFG, 1994).
DRAFT 4 - 18 - 11 revised 6 - 13 - 11 Goal = 750,000 (Final Restoration Plan) 1992-2010 Average = 373,033 1967-1991 Average = 374,049 Estimated number of adult of fall-run Chinook Figure 2. Estimated yearly natural production and in-river escapement of adult fall-run Chinook salmon in the Central Valley rivers and streams. 1952 - 1966 and 1992 - 2010 numbers are from CDFG Grand Tab (February 2, 2011). Baseline numbers (1967 - 1991) are from Mills and Fisher (CDFG, 1994).
DRAFT 4 - 18 - 11 revised 6 - 13 - 11 Goal = 110,000 (Final Restoration Plan) Estimated number of adult winter-run Chinook Data not available 1967-1991 Average = 54,439 1992-2010 Average = 6,595 Figure 3. Estimated yearly natural production and in river escapement of adult winter-run Chinook salmon in the Central Valley rivers and streams. 1992 - 2010 numbers are from CDFG Grand Tab (February 2, 2011). Baseline numbers (1967-1991) are from Mills and Fisher (CDFG, 1994).
DRAFT 4 - 18 - 11 revised 6 - 13 - 11 Goal = 68,000 (Final Restoration Plan) Estimated number of adult late-fall Chinook 1967-1991 Average = 34,192 1992-2010 Average = 17,822 Data not available Figure 4. Estimated yearly natural production and in-river escapements of adult late-fall-run Chinook salmon in the Central Valley rivers and streams. 1992 – 2010 numbers are from CDFG Grand Tab (February 2, 2011). Baseline numbers (1967 - 1991)are from Mills and Fisher (CDFG, 1994).
DRAFT 4 - 18 - 11 revised 6 - 13 - 11 Goal = 68,000 (Final Restoration Plan) Estimated number of adult spring-run Chinook 1967-1991 Average = 34,374 1992-2010 Average =14,124 Data not available Figure 5. Estimated yearly natural production and in-river escapement of adult spring-run Chinook salmon in the Central Valley rivers and streams. 1960 - 1966 and 1992 - 2010 numbers are from CDFG Grand Tab (February 2, 2011). Baseline numbers (1967 - 1991) are from Mills and Fisher (CDFG, 1994).
DRAFT 4 - 18 - 11 revised 6 - 13 - 11 Goal = 230,000 (Final Restoration Plan) Estimated number of adult fall-run Chinook, Hatchery escapement only, 1952 - 1955 1967-1991 Average = 115,371 1992-2010 Average = 75,506 Figure 6. Estimated yearly natural production and in-river escapement for the entire mainstem Sacramento River adult fall-run Chinook salmon. 1952 - 1966 and 1992 - 2010 numbers are from CDFG Grand Tab (February 2, 2011). Baseline numbers (1967 - 1991) are from Mills and Fisher (CDFG, 1994).
DRAFT 4 - 18 - 11 revised 6 - 13 - 11 Goal = 68,000 (Final Restoration Plan) Estimated number of adult late-fall-run Chinook 1967-1991 Average = 33,941 1992-2010 Average = 18,094 Data not available Figure 7. Estimated yearly natural production and in-river adult escapement for above RBDD mainstem Sacramento River late-fall-run Chinook salmon. 1992 -2010 numbers are from CDFG Grand Tab (February 2, 2011). Baseline numbers (1967 – 1991) are from Mills and Fisher (CDFG, 1994).
DRAFT 4 - 18 - 11 revised 6 - 13 - 11 Goal = 59,000 (Final Restoration Plan) Estimated number of adult spring-run Chinook 1967-1991 Average = 29,412 Data not available 1992-2010 Average = 750 Figure 8. Estimated yearly natural production and in river adult escapement for above RBDD mainstem Sacramento River spring-run Chinook salmon. 1992-2010 numbers are from CDFG Grand Tab (February 2, 2011). Baseline numbers (1967 - 1991) are from Mills and Fisher (CDFG, 1994).
DRAFT 4 - 18 - 11 revised 6 - 13 - 11 Goal = 110,000 (Final Restoration Plan) Estimated number of adult winter-run Chinook 1967-1991 Average = 54,316 Data not available 1992-2010 Average = 6,595 Figure 9. Estimated yearly natural production and in river adult escapement for above RBDD mainstem Sacramento River winter-run Chinook salmon. 1992 - 2010 numbers are from CDFG Grand Tab (February 2, 2011). Baseline numbers (1967 - 1991) are from Mills and Fisher (CDFG, 1994).
DRAFT 4 - 18 - 11 revised 6 - 13 - 11 Estimated number of adult fall-run Chinook 1992-2010 Average = 10,940 Goal = 7,100 (Final Restoration Plan) 1967-1991 Average = 3,576 Figure 10. Estimated yearly natural production and in river adult escapement of Clear Creek fall-run Chinook salmon. = data was not available for 1952, 1961, 1970-1975, 1979, 1980, 1983. 1953 – 1966 and 1992 - 2010 numbers are from CDFG Grand Tab (February 2, 2011). Baseline numbers (1967 - 1991) are from Mills and Fisher (CDFG, 1994).
DRAFT 4 - 18 - 11 revised 6 - 13 - 11 Estimated number of adult fall-run Chinook Goal = 5,900 (Final Restoration Plan) 1967-1991 Average = 2,964 1992-2010 Average = 1,584 Figure 11. Estimated yearly natural production and in river adult escapement of Cottonwood Creek fall-run Chinook salmon. = data was not available for 1952, 1970 - 1975, 1979 - 1980 and 1993 - 2005. 1952 - 1966 and 1992 - 2010 numbers are from CDFG Grand Tab (February 2, 2011). Baseline numbers (1967 - 1991) are from Mills and Fisher (CDFG, 1994).
DRAFT 4 - 18 - 11 revised 6 - 13 - 11 Estimated number of adult fall-run Chinook Goal = 4,600 (Final Restoration Plan) 1992-2010 Average = 1,837 1967-1991 Average = 2,330 Figure 12. Estimated yearly natural production and in river escapement of Cow Creek adult fall-run Chinook salmon. = data was not available for 1952, 1961, 1963, 1970 - 1975, 1977 - 1983, and 1992 - 2005. 1952 – 1966 and 1992-2010 numbers are from CDFG Grand Tab (February 2, 2011). Baseline numbers (1967 - 1991) are from Mills and Fisher (CDFG, 1994).
DRAFT 4 - 18 - 11 revised 6 - 13 - 11 Coleman National Fish Hatchery on the creek. Hatchery proportion = 0.9 Estimated number of adult fall-run Chinook The high adult escapement numbers compared to production estimates indicates a hatchery contribution to the in-river numbers. 1992-2010 Average = 17,977 Goal = 10,000 (Final Restoration Plan) 1967-1991 Average = 5,013 Figure 13. Estimated yearly natural production and in river escapement of Battle Creek adult fall-run Chinook salmon. 1952 - 1966 and 1992 - 2010 numbers are from CDFG Grand Tab (February 2, 2011). Baseline numbers (1967 - 1991) are from Mills and Fisher (CDFG, 1994).
DRAFT 4 - 18 - 11 revised 6 - 13 - 11 Coleman National Fish Hatchery on the creek. Hatchery proportion = 0.9 The high adult escapement numbers compared to production estimates indicates a hatchery contribution to the in-river numbers. Estimated number of adult late-fall-run Chinook Goal = 550 (Final Restoration Plan) 1992-2010 Average = 681 1967-1991 Average = 273 Figure 14. Estimated yearly natural production calculated from hatchery returns (in river returns were available starting in 2000) and hatchery returns of Battle Creek adult late-fall-run Chinook salmon. 1992 - 2010 numbers are from CDFG Grand Tab (February 2, 2011). = data was not available for 1952-1968. Baseline numbers (1967 - 1991) are from Mills and Fisher (CDFG, 1994).
DRAFT 4 - 18 - 11 revised 6 - 13 - 11 Goal = 330 (Final Restoration Plan) Estimated number of adult fall-run Chinook 1967-1991 Average = 170 1992-2010 Average = data not available Figure 15. Estimated yearly natural production and in river escapement of Paynes Creek adult fall-run Chinook salmon. = data was not available for 1952 - 1964, 1967 - 1968, 1970 - 1981, and 1990 - 2010 1965-1966 numbers are from CDFG Grand Tab (February 2, 2011). Baseline numbers (1967 - 1991) are from Mills and Fisher (CDFG, 1994).
DRAFT 4 - 18 - 11 revised 6 - 13 - 11 Estimated number of adult fall-run Chinook Goal = 720 (Final Restoration Plan) 1967-1991 Average = 361 1992-2010 Average = 0 Figure 16. Estimated yearly natural production and in river escapement of Antelope Creek adult fall-run Chinook salmon. = data was not available for 1952, 1959, 1961, 1978 - 1980, 1987, 1990, 1991, and 1993 – 2010. 1952 - 1966 and 1992 - 2010 numbers are from CDFG Grand Tab (February 2, 2011). Baseline numbers (1967 - 1991) are from Mills and Fisher (CDFG, 1994).
DRAFT 4 - 18 - 11 revised 6 - 13 - 11 Estimated number of adult fall-run Chinook 1992-2010 Average = 845 Goal = 1,500 (Final Restoration Plan) 1967-1991 Average = 766 Figure 17. Estimated yearly natural production and in river escapement of Deer Creek adult fall-run Chinook salmon. = data was not available for 1955, 1961, 1990 - 1992, 1995, 1996, and 1999 - 2003. 1952 - 1966 and 1992 - 2010 numbers are from CDFG Grand Tab (February 2, 2011). Baseline numbers (1967 - 1991) are from Mills and Fisher (CDFG, 1994).
DRAFT 4 - 18 - 11 revised 6 - 13 - 11 Estimated number of adult spring-run Chinook Goal = 6,500 (Final Restoration Plan) 1967-1991 Average = 3,276 1992-2010 Average = 2,104 Figure 18. Estimated yearly natural production and in river escapement of Deer Creek adult spring-run Chinook salmon. = data was not available for 1952 - 1962, 1965 - 1969, 1977, 1979, 1984, and 1988. 1952 - 1966, and 1992 - 2010 numbers are from CDFG Grand Tab (February 2, 2011). Baseline numbers (1967 - 1991) are from Mills and Fisher (CDFG, 1994).
DRAFT 4 - 18 - 11 revised 6 - 13 - 11 Estimated number of adult fall-run Chinook Goal = 4,200 (Final Restoration Plan) 1992-2010 Average = 1,905 1967-1991 Average = 2,118 Figure 19. Estimated yearly natural production and in river escapement of Mill Creek adult fall-run Chinook salmon. = data was not available for 1990, 1995 - 1996, and 1999 - 2001. 1952 -1966 and 1992 – 2010 numbers are from CDFG Grand Tab (February 2, 2011). Baseline numbers (1967 – 1991) are from Mills and Fisher (CDFG, 1994).
DRAFT 4 - 18 - 11 revised 6 - 13 - 11 Estimated number of adult fall-run Chinook 1992-2010 Average = 1,235 Goal = 4,400 (Final Restoration Plan) 1967-1991 Average = 2,202 Figure 20. Estimated yearly natural production and in river escapement of Mill Creek adult spring-run Chinook salmon. = data was not available for 1952 - 1959, 1965 - 1969, 1976, 1977, 1979, and 1983. 1952 - 1966 and 1992 - 2010 numbers are from CDFG Grand Tab (February 2, 2011). Baseline numbers (1967 - 1991) are from Mills and Fisher (CDFG, 1994).
DRAFT 4 - 18 - 11 revised 6 - 13 - 11 Miscellaneous creeks above RBDD include Spring Gulch, China Gulch, Olney, Ash, Stillwater, Inks, and Bear creeks (Mills and Fisher). Estimated number of adult fall-run Chinook Goal = 1,100 (Final Restoration Plan) 1967-1991 Average = 549 1992-2010 Average = 82 Figure 21. Estimated yearly natural production of miscellaneous creeks adult fall-run Chinook salmon above RBDD. = data was not available for 1952 -1955, 1963 – 1968 and 1970 – 2006. 1952 – 1966 and 1992 - 2010 numbers are from CDFG Grand Tab (February 2, 2011). Baseline numbers (1967 - 1991) are from Mills and Fisher (CDFG, 1994).
DRAFT 4 - 18 - 11 revised 6 - 13 - 11 Estimated number of adult fall-run Chinook 1992-2010 Average = 2,466 Goal = 1,500 (Final Restoration Plan) 1967-1991 Average = 765 Figure 22. Estimated yearly natural production and in river escapement of Butte Creek adult fall-run Chinook salmon. = data was not available for 1952 - 1964, 1967 - 1970, 1973, 1977, 1979 - 1982, 1984, 1986,1987, 1990 -1994, and 1999 - 2001. 1952 - 1966 and 1992 - 2010 numbers are from CDFG Grand Tab (February 2, 2011). Baseline numbers (1967 – 1991) are from Mills and Fisher (CDFG, 1994).
DRAFT 4 - 18 - 11 revised 6 - 13 - 11 The Butte Creek is one of the tributaries where restoration work has been conducted since 1996. Estimated number of adult spring-run Chinook 1992-2010 Average = 10,035 Goal = 2,000 (Final Restoration Plan) 1967-1991 Average = 1,018 Figure 23. Estimated yearly natural production and in river escapement of Butte Creek adult spring-run Chinook salmon. 1952- 1966 and 1992 - 2010 numbers are from CDFG Grand Tab (February 2, 2011). = data was not available for 1952 - 1959. Baseline numbers (1967 - 1991) are from Mills and Fisher (CDFG, 1994).
DRAFT 4 - 18 - 11 revised 6 - 13 - 11 Goal = 800 (Final Restoration Plan) Estimated number of adult fall-run Chinook 1967-1991 Average = 402 1992-2010 Average = data not available Figure 24. Estimated yearly natural production, and in river escapements of Big Chico Creek adult fall-run Chinook salmon. = data was not available for 1952 - 1956, 1958 - 1982, and 1986 - 2009. 1952 - 1966 and 1992 - 2010 numbers are from CDFG Grand Tab (February 2, 2011). Baseline numbers (1967 - 1991) are from Mills and Fisher (CDFG, 1994).
DRAFT 4 - 18 - 11 revised 6 - 13 - 11 Feather River State Fish Hatchery on the river. Hatchery proportion = 0.4 Goal = 170,000 (Final Restoration Plan) 1992-2010 Average = 93,708 Estimated number of adult fall-run Chinook 1967-1991 Average = 86,031 Figure 25. Estimated yearly natural production, and in river escapements of Feather River adult fall-run Chinook salmon. In-river escapements were not available for 1998 and 1999. 1952 - 1966 and 1992 - 2010 numbers are from CDFG Grand Tab (February 2, 2011). Baseline numbers (1967 - 1991) are from Mills and Fisher (CDFG, 1994). 1998 and 1999 are hatchery escapement only. Starting in 2005 only fall-run returns are used for hatchery escapement.
DRAFT 4 - 18 - 11 revised 6 - 13 - 11 Goal = 66,000 (Final Restoration Plan) Estimated number of adult fall-run Chinook 1992-2010 Average = 32,808 1967-1991 Average = 33,267 Figure 26. Estimated yearly natural production and in river escapement of Yuba River adult fall-run Chinook salmon. 1967-1991 baseline numbers are from Mills and Fisher (CDFG, 1994). 1952 - 1966 and 1992-2010 numbers are from CDFG Grand Tab (February 2, 2011). = data was not available for 1952.
DRAFT 4 - 18 - 11 revised 6 - 13 - 11 1967-1991 Average = 639 is based on only one year Goal = 450 (Final Restoration Plan) Estimated number of adult fall-run Chinook 1992-2010 Average = data not available Figure 27. Estimated yearly natural production and in river escapement of Bear River adult fall-run Chinook salmon. = data was not available for 1952 - 1983, and 1985 – 2010. Numbers are from CDFG Grand Tab (February 2, 2011).
DRAFT 4 - 18 - 11 revised 6 - 13 - 11 Nimbus State Fish Hatchery on the river. Hatchery proportion = 0.4 Goal = 160,000 (Final Restoration Plan) Estimated number of adult fall-run Chinook 1992-2010 Average = 109,574 1967-1991 Average = 80,876 Figure 28. Estimated yearly natural production and in river escapement of American River adult fall-run Chinook salmon. 1952 - 1966, and 1992 - 2010 numbers are from CDFG Grand Tab (February 2, 2011). Baseline numbers (1967 - 1991) are from Mills and Fisher (CDFG, 1994).
DRAFT 4 - 18 - 11 revised 6 - 13 - 11 Estimated number of adult fall-run Chinook Goal = 3,300 (Final Restoration Plan) 1967-1991 Average = 1,660 1992-2010 Average = 802 Figure 29. Estimated yearly natural production and in river escapement of Cosumnes River adult fall-run Chinook salmon. = data was not available for 1952, 1959, 1961, 1976-1977, 1982, 1986, 1987, 1989 - 1997, and 2001. 1952-1966 and 1992-2010 numbers are from CDFG Grand Tab (February 2, 2011). Baseline numbers (1967 - 1991) are from Mills and Fisher (CDFG, 1994).
DRAFT 4 - 18 - 11 revised 6 - 13 - 11 Mokelumne River State Fish Hatchery on the river. Hatchery proportion = 0.4 Goal = 9,300 (Final Restoration Plan) Estimated number of adult fall-run Chinook 1967 - 1991 Average = 4,680 1992-2010 Average = 8,024 Figure 30. Estimated yearly natural production and in river escapement of Mokelumne River adult fall-run Chinook salmon. In river escapement numbers were not available for 2001. 1952 – 1966 and 1992 - 2010 numbers are from CDFG Grand Tab (February 2, 2011). Baseline numbers (1967 - 1991) are from Mills and Fisher (CDFG, 1994).
DRAFT 4 - 18 - 11 revised 6 - 13 - 11 Goal = 2,200 (Final Restoration Plan) Estimated number of adult winter-run Chinook 1967 -1991 Average = 770 1992-2010 Average = 0 Figure 31. Estimated yearly natural production of Calaveras River adult winter-run Chinook salmon. = data was not available for 1952 - 1974, 1977, 1979 – 1983, and 1985 - 2006. 1952 - 2010 numbers are from CDFG Grand Tab (February 2, 2011). Baseline numbers from Mills and Fisher (CDFG, 1994) were not available.
DRAFT 4 - 18 - 11 revised 6 - 13 - 11 Estimated number of adult fall-run Chinook Goal = 22,000 (Final Restoration Plan) 1992-2010Average = 5,334 1967-1991 Average = 10,868 Figure 32. Estimated yearly natural production and in river escapement of Stanislaus River adult fall-run Chinook salmon. 1952 – 1966 and 1992 - 2010 numbers are from CDFG Grand Tab (February 2, 2011). Baseline numbers (1967 - 1991) are from Mills and Fisher (CDFG, 1994). = data was not available for 1982.
DRAFT 4 - 18 - 11 revised 6 - 13 - 11 Estimated number of adult fall-run Chinook Goal = 38,000 (Final Restoration Plan) 1967-1991 Average = 18,949 1992-2010 Average = 7,186 Figure 33. Estimated yearly natural production and in river escapement of Tuolumne River adult fall-run Chinook salmon. 1952 - 1966, and 1992 - 2010 numbers are from CDFG Grand Tab (February 2, 2011). Baseline numbers (1967 - 1991) are from Mills and Fisher (CDFG, 1994).
DRAFT 4 - 18 - 11 revised 6 - 13 - 11 Merced River State Fish Hatchery on the river. Hatchery proportion = 0.1 Estimated number of adult fall-run Chinook Goal = 18,000 (Final Restoration Plan) 1992-2010 Average = 6,845 1967-1991 Average = 9,005 Figure 34. Estimated yearly natural production and in river escapement of Merced River adult fall-run Chinook salmon. 1952 - 1966, and 1992 - 2010 numbers are from CDFG Grand Tab (February 2, 2011). = data was not available for 1952 - 1953, and 1955 - 1956. Baseline numbers (1967 - 1991) are from Mills and Fisher (CDFG, 1994).
DRAFT 4 - 18 - 11 revised 6 - 13 - 11 Estimated number of adult fall-run Chinook 1967 - 1991 Average = 38,388 1992 -2010 Average = 19,365 Figure 35. Estimated yearly natural production, and in river escapements of San Joaquin System adult fall-run Chinook salmon. The San Joaquin System is the sum of the Stanislaus, Tuolumne, and Merced Rivers. 1952 - 1966, and 1992 - 2010 numbers are from CDFG Grand Tab (February 2, 2011). Baseline numbers (1967 - 1991) are from Mills and Fisher (CDFG, 1994).
DRAFT 4 - 18 - 11 revised 6 - 13 - 11 Steelhead. Steelhead estimates are derived from direct counts at fishways and at hatcheries. Some estimates are the result of mark-recapture experiments, and some are a variant calculated by dividing hatchery returns by the estimated harvest rates. Doubling goal = 13,000 (above RBDD only; information from other Sacramento River tributaries and the San Joaquin system was not included in Mills and Fisher (1994) for the baseline period) Estimated natural spawning Sacramento River steelhead above RBDD 1967-1991 Average = 6,574 1992-2008 Average = 1,127 Figure 36. Estimated yearly number of natural spawning of steelhead on the Sacramento River, upstream of the RBDD (Mills and Fisher, 1994). Data for 1992-2008 is from CDFG, Red Bluff. 2008 sampling was curtailed in June due to high water temperatures.
DRAFT 4 - 18 - 11 revised 6 - 13 - 11 Doubling goal based on the population estimate = 155,050 1992-2005 population estimate average = 78,649 1967-1991 population estimate average = 77,525 Estimated number of white sturgeon 1992-2005 natural production average = 5,507 1967-1991 natural production average = 5,571 Natural production doubling goal = 11,000 Figure 37. Yearly population estimates and natural production estimates of white sturgeon in the Central Valley. Population estimates are for >= 40 inch fish, while natural production estimates are based on age 15 fish. 1967-1991 baseline numbers are from the Working Papers on Restoration Needs, Vol. 3 (1995), and 1992-2001 numbers are from CDFG, Bay Delta. = data was not available for 1991-1992, 1995-1996, 1999-2000, and 2003-2004.
DRAFT 4 - 18 - 11 revised 6 - 13 - 11 Year white sturgeon ration white to green green sturgeon 1967 114,700 62.0:1 1,850 1968 40,000 38.6:1 1,036 1974 20,700 101.9:1 203 1979 74,500 52.6:1 1,416 1984 119,800 106.3:1 1,127 1985 107,700 127.3:1 846 1987 106,100 163.7:1 648 1990 36,700 49.6:1 738 data from Working Papers, Vol. 3 1993 18,257 267.0:1 68 1994 144,672 ----- ---- 1997 143,795 110.1:1 1,306 1998 98,717 209.9:1 470 2001 57,641 8.1:1 7,117 2002 32,283 19.1:1 1,690 2005 55,180 21.6:1 2,555 data from CDFG Bay Delta Estimated number of green sturgeon 1992-2005 Average = 2,201 Doubling goal = 1,966 1967-1991 Average = 983 Figure 38. Yearly estimated abundance of green sturgeon in the Central Valley. 1967-1991 baseline numbers are from the Working Paper on Restoration Needs, Vol. 3 (1995), and 1992-2005 numbers are from CDFG, Bay Delta. = data was not available for 1969-1973, 1975-1978, 1980-1983, 1986, 1988-1989, 1991-1992, 1994-1996, 1999-2000, and 2004-2005. Green sturgeon estimates were based on a ratio of white to green sturgeon captured during those years when DFG was sampling for these fish.
DRAFT 1 – 4 - 11 1992-2009 Average = 2,573 Doubling goal = 4,300 Estimated number of American shad 1967-1991 Average = 2,193 Figure 39. Yearly estimated abundance of American shad in the Central Valley, 1967 through 2005. Data, based on juvenile abundance from CDFG, Central Valley Bay Delta Branch (CVBDB) fall midwater trawl, was used as an index of production. 1967 – 1988 data is from the Working Papers, Vol.3, and 1989 – 2009 data is the from CDFG, CVBDB midwater trawl website. The Working Papers and CVBDB site a young-of year index .
DRAFT 4 - 18 - 11 revised 6 - 13 - 11 Doubling goal = 2,500,000 1967-1991 Total Average = 1,252,259 Estimated number of striped bass 1992-2007 Total Average = 885,670 Figure 40. Yearly estimated abundance of adult sized (> 15 inches before 1982, and > 16.5 inches thereafter) striped bass in the Central Valley. Data is from the Mills and Fisher (1967-1991), and CDFG, Bay Delta (1992-2007). = data was not available for 1995, 1997, 1999, 2001, and 2006.